emooki
HomePrice mapTransactions
🇬🇧 English🇫🇷 Français🇩🇪 Deutsch🇪🇸 Español🇮🇹 Italiano

Real estate price map


Real estate price map in the municipality of Barbazan-Debat, choose a section to see transactions by parcel.

Hautes-Pyrénées (65)

Barbazan-Debat - Real estate price m²

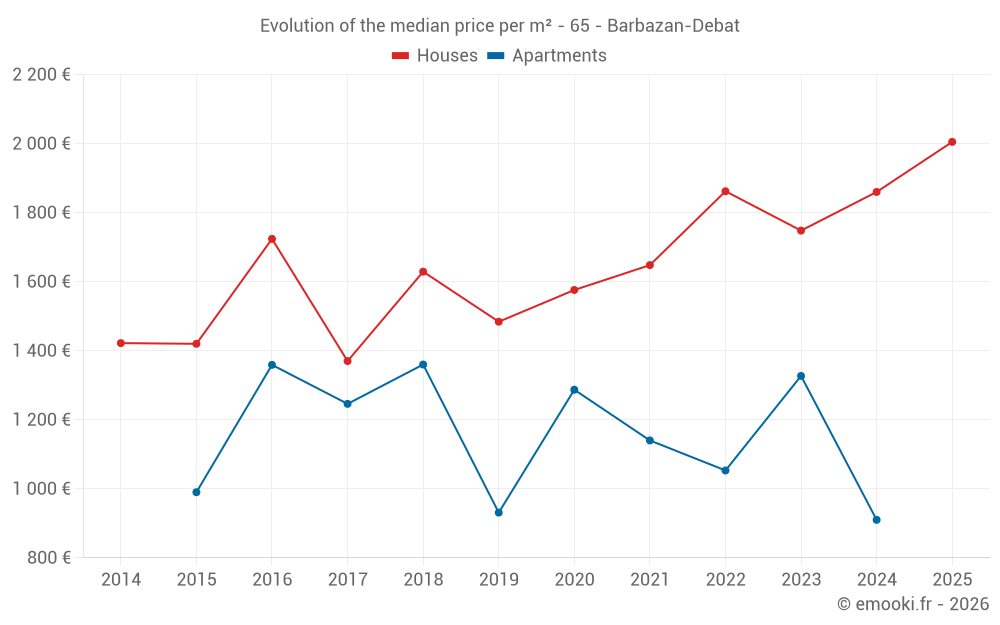
Median price of real estate
in the municipality of Barbazan-Debat

HousesHouses
1 882  /m²
1-23-45-67-89-10
Reliability 8/10
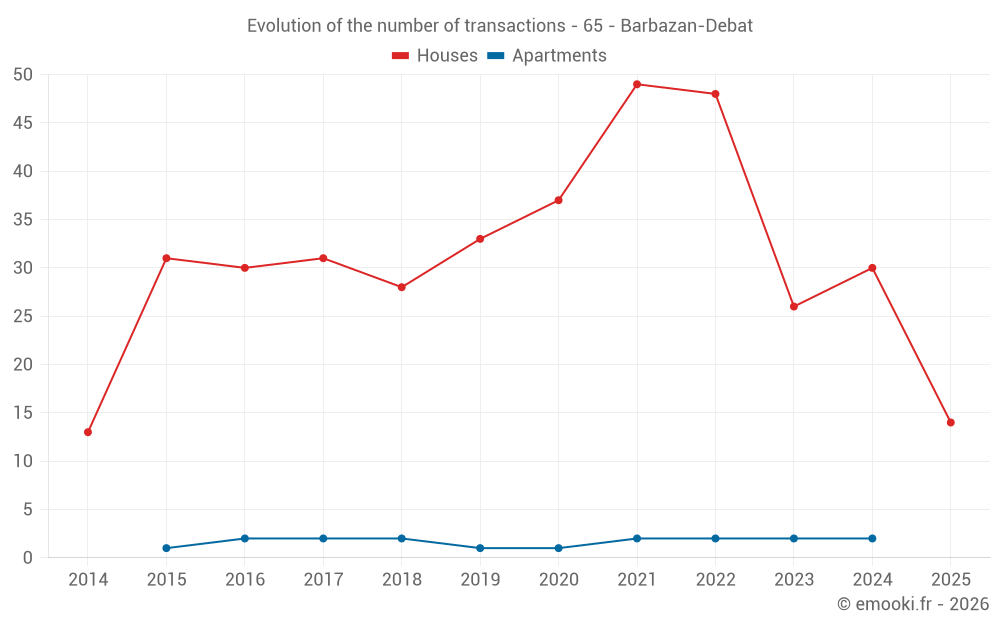
Median price on the 29 transactions of the last 12 months.
from 1 319 to
2 375  /m²
60% of transactions from the 2nd to the 8th deciles.
ApartmentsApartments
1 056  /m²
1-23-45-67-89-10
Reliability 4/10
Median price on the 9 transactions of the last 60 months.
DwellingsDwellings
1 860  /m²
1-23-45-67-89-10
Reliability 8/10
Median price on the 30 transactions of the last 12 months.
from 1 285 to
2 351  /m²
60% of transactions from the 2nd to the 8th deciles.
HousesEvolution of the price per m² of houses since...
1 year
+7.8%
2 years
+15%
3 years
+7.7%
4 years
+22%
5 years
+27%
6 years
+35%
7 years
+23%
8 years
+46%
9 years
+16%
10 years
+41%
11 years
+41%

Yearly evolution

Evolution of the median price per m²

Evolution of the median price per m² - 65 - Barbazan-Debat

Evolution of the number of transactions

Warning, last year incomplete. Projections made based on the proportions between semesters of the previous year at the departmental/national level and by type of property.

Evolution of the number of transactions - 65 - Barbazan-Debat

Yearly data

Descending order
Year
Houses
house
transactions
Houses
house
Price per m²
Apartments
apt.
transactions
Apartments
apt.
Price per m²
2025
14
2 005 
0
--- 
2024
30
1 860 
2
910 
2023
26
1 748 
2
1 327 
2022
48
1 862 
2
1 053 
2021
49
1 648 
2
1 140 
2020
37
1 576 
1
1 287 
2019
33
1 484 
1
931 
2018
28
1 629 
2
1 360 
2017
31
1 370 
2
1 246 
2016
30
1 724 
2
1 359 
2015
31
1 420 
1
990 
2014
13
1 422 
0
--- 

Analysis

Structure of prices per m²

Values of price percentiles per m² over the periods used for the estimated price of each type of property.

Structure of transaction amounts

Values of transaction amounts percentiles over the periods used for the estimated price of each type of property.

Transaction amounts and prices per m² by percentile

Ascending order
Percentile
Houses
house
Price per m²
Houses
house
Transaction amount
Apartments
apt.
Price per m²
Apartments
apt.
Transaction amount
10th percentile
1 050 
95 520 
742 
75 000 
20th percentile
1 319 
150 K
918 
84 000 
30th percentile
1 618 
175 K
1 036 
102 K
40th percentile
1 691 
179 K
1 056 
120 K
50th percentile
1 882 
190 K
1 056 
120 K
60th percentile
1 945 
195 K
1 078 
128 K
70th percentile
2 160 
232 K
1 206 
135 K
80th percentile
2 375 
274 K
1 411 
145 K
90th percentile
2 730 
321 K
1 603 
169 K

National and departmental comparison

Evolution of the median price per m² of houses

Evolution of the median price per m² of apartments

Quarterly evolution

Evolution of the median price per m²

Evolution of the number of transactions

Quarterly data

Descending order
Quarter
Houses
house
transactions
Houses
house
Price per m²
Apartments
apt.
transactions
Apartments
apt.
Price per m²
2025 Q2
4
2 000 
0
--- 
2025 Q1
10
2 005 
0
--- 
2024 Q4
6
1 816 
1
763 
2024 Q3
9
1 839 
0
--- 
2024 Q2
11
1 729 
0
--- 
2024 Q1
4
1 988 
1
1 056 
2023 Q4
4
1 776 
0
--- 
2023 Q3
8
1 637 
2
1 327 
2023 Q2
8
1 942 
0
--- 
2023 Q1
6
1 810 
0
--- 
2022 Q4
15
1 953 
0
--- 
2022 Q3
17
1 910 
1
1 022 
2022 Q2
7
1 426 
0
--- 
2022 Q1
9
1 975 
1
1 084 
2021 Q4
7
1 587 
0
--- 
2021 Q3
15
1 798 
2
1 140 
2021 Q2
12
1 510 
0
--- 
2021 Q1
15
1 733 
0
--- 
2020 Q4
12
1 558 
1
1 287 
2020 Q3
11
1 723 
0
--- 
2020 Q2
8
1 652 
0
--- 
2020 Q1
6
1 324 
0
--- 
2019 Q4
11
1 327 
0
--- 
2019 Q3
10
1 594 
0
--- 
2019 Q2
10
1 286 
0
--- 
2019 Q1
2
1 522 
1
931 
2018 Q4
3
1 857 
0
--- 
2018 Q3
9
1 527 
1
1 535 
2018 Q2
7
1 792 
1
1 186 
2018 Q1
9
1 689 
0
--- 
2017 Q4
6
1 609 
0
--- 
2017 Q3
13
1 256 
0
--- 
2017 Q2
7
1 802 
1
1 244 
2017 Q1
5
1 324 
1
1 248 
2016 Q4
6
1 396 
0
--- 
2016 Q3
12
1 657 
1
1 165 
2016 Q2
5
1 716 
0
--- 
2016 Q1
7
1 802 
1
1 553 
2015 Q4
9
1 334 
1
990 
2015 Q3
9
1 724 
0
--- 
2015 Q2
10
1 470 
0
--- 
2015 Q1
3
1 303 
0
--- 
2014 Q4
2
976 
0
--- 
2014 Q3
4
1 661 
0
--- 
2014 Q2
6
1 370 
0
--- 
2014 Q1
1
1 309 
0
--- 

Overview of the latest real estate transactions

The following list is an anonymized overview of the latest transactions. For more details and to find all transactions, please use the map to view transactions by plot or the transaction search page for a search by criteria.

2025-06-23
369 600 
Sale
Land
907 m2
-Terres
2025-06-13
256 000 
2 327  /m²(110 m²)
Sale
Houses
House
5 rooms
110 m2
Land
395 m2
-Sols
2025-06-03
45 464 
Sale
Land
384 m2
-Prés
Land
545 m2
-Prés
2025-06-03
37 908 
Sale
Land
65 m2
-Prés
Land
420 m2
-Prés
Land
45 m2
-Prés
2025-05-28
2 640 
Sale
Land
4350 m2
-Terres
Land
4450 m2
-Terres
2025-05-28
169 500 
1 784  /m²(95 m²)
Sale
Houses
House
5 rooms
95 m2
Land
1113 m2
-Sols
Land
121 m2
-Jardins
Land
223 m2
-Jardins
2025-05-23
241 600 
2 217  /m²(109 m²)
Sale
Houses
House
4 rooms
109 m2
1 outbuilding
Land
619 m2
-Sols
Land
619 m2
-Jardins
2025-04-29
367 050 
1 330  /m²(276 m²)
Sale
Houses
House
6 rooms
276 m2
1 outbuilding
Land
2420 m2
-Sols
2025-04-17
85 000 
Sale
Land
861 m2
-Terrains à bâtir
2025-03-31
1 
Sale
Land
73 m2
-Terres
2025-03-31
320 400 
3 483  /m²(92 m²)
Sale
Houses
House
4 rooms
92 m2
1 outbuilding
Land
797 m2
-Sols
Land
332 m2
-Terres
Land
101 m2
-Terres
2025-03-25
190 000 
1 939  /m²(98 m²)
Sale
Houses
House
4 rooms
98 m2
Land
583 m2
-Sols
2025-03-20
233 670 
2 717  /m²(86 m²)
Sale
Houses
House
4 rooms
86 m2
Land
430 m2
-Sols
2025-03-18
275 000 
Sale
Land
248 m2
-Terrains à bâtir
Land
339 m2
-Terrains à bâtir
Land
385 m2
-Terrains à bâtir
Land
187 m2
-Terrains à bâtir
Land
187 m2
-Terrains à bâtir
Land
329 m2
-Terrains à bâtir
Land
329 m2
-Terrains à bâtir
Land
187 m2
-Terrains à bâtir
Land
187 m2
-Terrains à bâtir
Land
290 m2
-Terrains à bâtir
Land
281 m2
-Terrains à bâtir
Land
977 m2
-Terres
2025-03-17
46 000 
341  /m²(135 m²)
Sale
Houses
House
5 rooms
135 m2
Land
581 m2
-Sols
2025-03-17
190 000 
1 000  /m²(190 m²)
Sale
Houses
House
7 rooms
190 m2
1 outbuilding
Land
1000 m2
-Sols
Land
3433 m2
-Prés
2025-02-25
333 910 
2 783  /m²(120 m²)
Sale
Houses
House
4 rooms
120 m2
Land
1017 m2
-Sols
2025-02-14
192 600 
2 071  /m²(93 m²)
Sale
Houses
House
4 rooms
93 m2
1 outbuilding
Land
286 m2
-Terrains à bâtir
2025-02-07
176 810 
1 668  /m²(106 m²)
Sale
Houses
House
5 rooms
106 m2
Land
166 m2
-Sols
2025-01-29
60 000 
870  /m²(69 m²)
Sale
Commercial property
69 m2
Land
51 m2
-Sols
Land
14 m2
-Sols
602 transactions listed in the municipality

Hautes-Pyrénées (65)

Most expensive cities

City
name
Descending orderHouses
house
Price per m²
4 315 
3 974 
3 548 
3 375 
3 300 
3 216 
3 205 
3 119 
3 080 
City
name
Descending orderApartments
apt.
Price per m²
5 224 
3 906 
3 772 
3 380 
3 323 
3 321 
3 128 
3 116 
3 000 

Least expensive cities

City
name
Ascending orderHouses
house
Price per m²
508 
536 
566 
571 
642 
654 
674 
676 
City
name
Ascending orderApartments
apt.
Price per m²
76 
224 
333 
341 
370 
462 
500 
502