emooki
HomePrice mapTransactions
🇬🇧 English🇫🇷 Français🇩🇪 Deutsch🇪🇸 Español🇮🇹 Italiano

Real estate price map


Real estate price map in the municipality of Aragnouet, choose a section to see transactions by parcel.

Hautes-Pyrénées (65)

Aragnouet - Real estate price m²

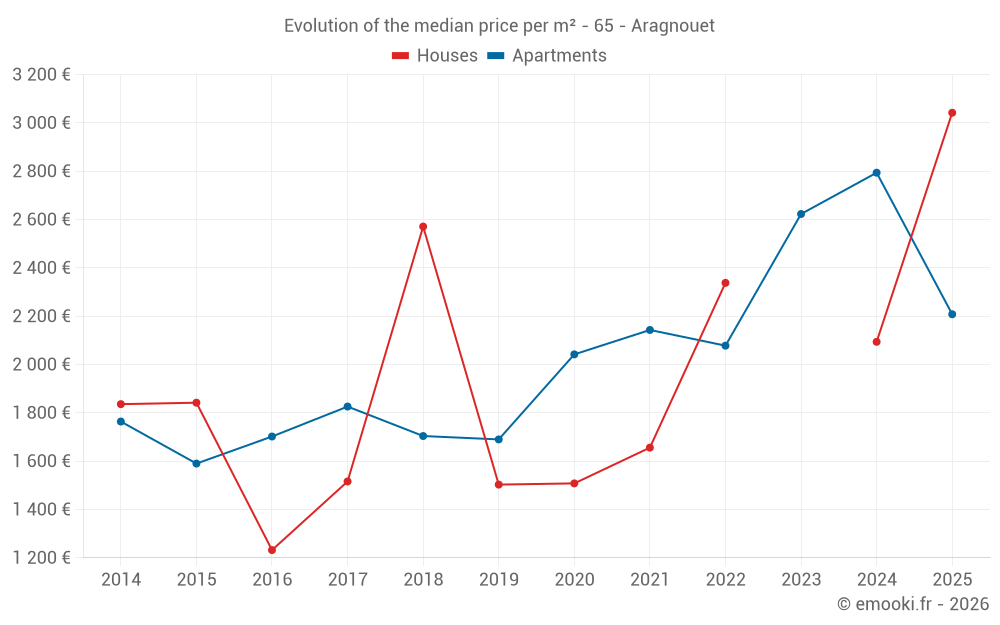
Median price of real estate
in the municipality of Aragnouet

HousesHouses
2 338  /m²
1-23-45-67-89-10
Reliability 5/10
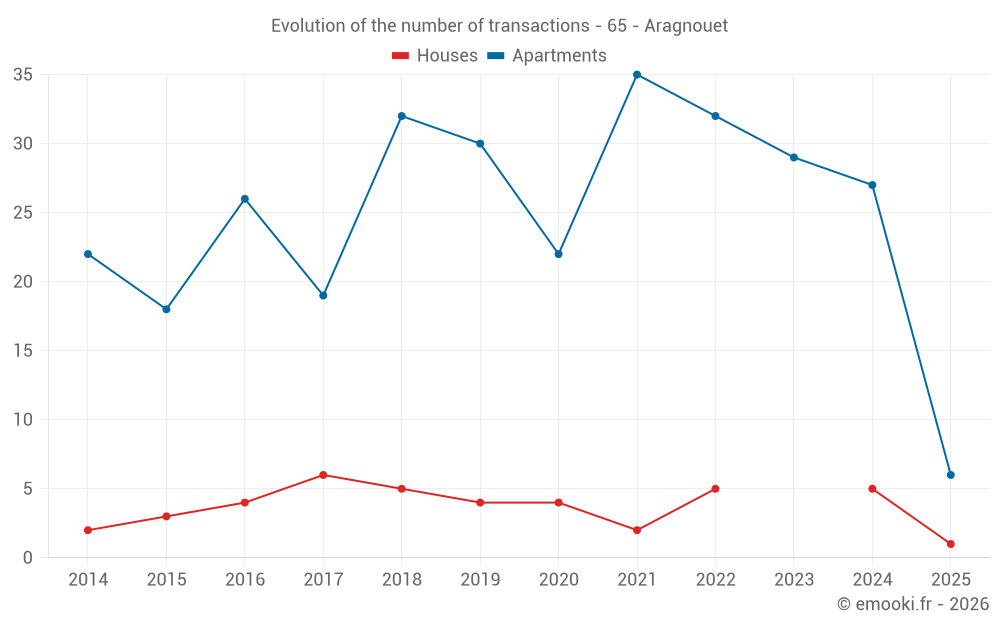
Median price on the 13 transactions of the last 48 months.
from 1 463 to
2 672  /m²
60% of transactions from the 2nd to the 8th deciles.
ApartmentsApartments
2 768  /m²
1-23-45-67-89-10
Reliability 8/10
Median price on the 20 transactions of the last 12 months.
from 1 936 to
3 142  /m²
60% of transactions from the 2nd to the 8th deciles.
DwellingsDwellings
2 742  /m²
1-23-45-67-89-10
Reliability 8/10
Median price on the 23 transactions of the last 12 months.
from 1 921 to
3 124  /m²
60% of transactions from the 2nd to the 8th deciles.
ApartmentsEvolution of the price per m² of apartments since...
1 year
-21%
2 years
-16%
3 years
+6.3%
4 years
+3%
5 years
+8.1%
6 years
+31%
7 years
+30%
8 years
+21%
9 years
+30%
10 years
+39%
11 years
+25%
The price per m² of apartments has decreased by 21% since 1 year, but it has increased by 39% in 10 years.

Yearly evolution

Evolution of the median price per m²

Evolution of the median price per m² - 65 - Aragnouet

Evolution of the number of transactions

Warning, last year incomplete. Projections made based on the proportions between semesters of the previous year at the departmental/national level and by type of property.

Evolution of the number of transactions - 65 - Aragnouet

Yearly data

Descending order
Year
Houses
house
transactions
Houses
house
Price per m²
Apartments
apt.
transactions
Apartments
apt.
Price per m²
2025
1
3 042 
6
2 208 
2024
5
2 094 
27
2 794 
2023
0
--- 
29
2 623 
2022
5
2 338 
32
2 078 
2021
2
1 656 
35
2 143 
2020
4
1 508 
22
2 042 
2019
4
1 503 
30
1 690 
2018
5
2 571 
32
1 704 
2017
6
1 516 
19
1 826 
2016
4
1 232 
26
1 702 
2015
3
1 842 
18
1 590 
2014
2
1 836 
22
1 764 

Analysis

Structure of prices per m²

Values of price percentiles per m² over the periods used for the estimated price of each type of property.

Structure of transaction amounts

Values of transaction amounts percentiles over the periods used for the estimated price of each type of property.

Transaction amounts and prices per m² by percentile

Ascending order
Percentile
Houses
house
Price per m²
Houses
house
Transaction amount
Apartments
apt.
Price per m²
Apartments
apt.
Transaction amount
10th percentile
1 024 
93 200 
1 776 
40 920 
20th percentile
1 463 
139 K
1 936 
51 180 
30th percentile
1 954 
179 K
2 046 
56 680 
40th percentile
2 223 
191 K
2 277 
74 180 
50th percentile
2 338 
208 K
2 768 
83 390 
60th percentile
2 499 
213 K
2 861 
92 432 
70th percentile
2 629 
237 K
2 974 
103 K
80th percentile
2 672 
274 K
3 142 
111 K
90th percentile
2 968 
331 K
3 303 
123 K

National and departmental comparison

Evolution of the median price per m² of houses

Evolution of the median price per m² of apartments

Quarterly evolution

Evolution of the median price per m²

Evolution of the number of transactions

Quarterly data

Descending order
Quarter
Houses
house
transactions
Houses
house
Price per m²
Apartments
apt.
transactions
Apartments
apt.
Price per m²
2025 Q2
1
3 042 
4
1 990 
2025 Q1
0
--- 
2
3 234 
2024 Q4
1
2 094 
10
2 460 
2024 Q3
1
1 277 
4
2 870 
2024 Q2
2
2 208 
6
2 974 
2024 Q1
1
2 603 
7
2 643 
2023 Q4
0
--- 
7
2 771 
2023 Q3
0
--- 
8
2 464 
2023 Q2
0
--- 
10
2 192 
2023 Q1
0
--- 
4
2 710 
2022 Q4
0
--- 
8
2 014 
2022 Q3
1
2 338 
8
2 955 
2022 Q2
1
2 473 
11
2 000 
2022 Q1
3
2 255 
5
1 687 
2021 Q4
1
2 669 
14
2 186 
2021 Q3
1
642 
6
2 026 
2021 Q2
0
--- 
7
2 188 
2021 Q1
0
--- 
8
2 011 
2020 Q4
1
331 
7
2 171 
2020 Q3
0
--- 
4
1 706 
2020 Q2
0
--- 
1
2 297 
2020 Q1
3
1 588 
10
2 018 
2019 Q4
2
1 503 
6
1 944 
2019 Q3
1
2 957 
13
1 726 
2019 Q2
1
1 053 
6
1 642 
2019 Q1
0
--- 
5
1 772 
2018 Q4
1
1 810 
9
1 828 
2018 Q3
1
2 571 
6
1 909 
2018 Q2
0
--- 
9
1 730 
2018 Q1
3
2 645 
8
1 500 
2017 Q4
3
1 432 
7
1 886 
2017 Q3
1
1 149 
3
1 984 
2017 Q2
2
1 752 
3
1 421 
2017 Q1
0
--- 
6
1 928 
2016 Q4
1
1 250 
9
1 973 
2016 Q3
1
1 214 
4
1 454 
2016 Q2
0
--- 
7
1 698 
2016 Q1
2
1 486 
6
1 632 
2015 Q4
1
1 842 
7
1 315 
2015 Q3
0
--- 
5
1 697 
2015 Q2
2
2 064 
2
1 500 
2015 Q1
0
--- 
4
1 814 
2014 Q4
1
1 349 
11
1 944 
2014 Q3
1
2 324 
5
1 294 
2014 Q2
0
--- 
1
2 107 
2014 Q1
0
--- 
5
1 734 

Overview of the latest real estate transactions

The following list is an anonymized overview of the latest transactions. For more details and to find all transactions, please use the map to view transactions by plot or the transaction search page for a search by criteria.

2025-06-20
190 500 
1 944  /m²(98 m²)
Sale
Apartments
Apartment
3 rooms
50 m2
Apartments
Apartment
1 room
24 m2
Apartments
Apartment
1 room
24 m2
3 outbuildings
Land
330 m2
-Sols
2025-04-29
55 000 
2 037  /m²(27 m²)
Sale
Apartments
Apartment
1 room
27 m2
1 outbuilding
2025-04-28
80 
Sale
Land
322 m2
-Prés
2025-04-25
75 000 
Sale
Land
4220 m2
-Prés
Land
1130 m2
-Terres
2025-04-22
22 000 
1 692  /m²(13 m²)
Sale
Apartments
Apartment
1 room
13 m2
1 outbuilding
2025-04-18
212 935 
3 042  /m²(70 m²)
Sale
Houses
House
3 rooms
70 m2
Land
108 m2
-Sols
Land
205 m2
-Jardins
2025-04-14
88 000 
2 378  /m²(37 m²)
Sale
Apartments
Apartment
3 rooms
37 m2
1 outbuilding
2025-03-11
81 700 
3 142  /m²(26 m²)
Sale
Apartments
Apartment
2 rooms
26 m2
1 outbuilding
2025-03-03
106 400 
3 325  /m²(32 m²)
Sale
Apartments
Apartment
2 rooms
32 m2
1 outbuilding
2024-12-23
119 820 
2 922  /m²(41 m²)
Sale
Apartments
Apartment
1 room
41 m2
1 outbuilding
2024-12-20
47 500 
2 794  /m²(17 m²)
Sale
Apartments
Apartment
1 room
17 m2
2 outbuildings
2024-12-17
102 210 
3 097  /m²(33 m²)
Sale
Apartments
Apartment
1 room
33 m2
1 outbuilding
2024-12-10
115 519 
3 301  /m²(35 m²)
Sale
Apartments
Apartment
1 room
35 m2
1 outbuilding
2024-12-06
57 400 
2 126  /m²(27 m²)
Sale
Apartments
Apartment
1 room
27 m2
1 outbuilding
2024-11-27
82 000 
2 050  /m²(40 m²)
Sale
Apartments
Apartment
1 room
40 m2
1 outbuilding
2024-11-21
167 500 
2 094  /m²(80 m²)
Sale
1 outbuilding
Land
12 m2
-Landes
/Friche
Houses
House
4 rooms
80 m2
Land
106 m2
-Sols
2024-11-15
99 081 
3 539  /m²(28 m²)
Sale
Apartments
Apartment
2 rooms
28 m2
2 outbuildings
2024-11-13
35 700 
1 785  /m²(20 m²)
Sale
Apartments
Apartment
1 room
20 m2
1 outbuilding
2024-10-28
41 500 
1 482  /m²(28 m²)
Sale
Apartments
Apartment
1 room
28 m2
2024-10-03
62 900 
1 906  /m²(33 m²)
Sale
Apartments
Apartment
1 room
33 m2
402 transactions listed in the municipality

Hautes-Pyrénées (65)

Most expensive cities

City
name
Descending orderHouses
house
Price per m²
4 315 
3 974 
3 548 
3 375 
3 300 
3 216 
3 205 
3 119 
3 080 
City
name
Descending orderApartments
apt.
Price per m²
5 224 
3 906 
3 772 
3 380 
3 323 
3 321 
3 128 
3 116 
3 000 

Least expensive cities

City
name
Ascending orderHouses
house
Price per m²
508 
536 
566 
571 
642 
654 
674 
676 
City
name
Ascending orderApartments
apt.
Price per m²
76 
224 
333 
341 
370 
462 
500 
502