emooki
HomePrice mapTransactions
🇬🇧 English🇫🇷 Français🇩🇪 Deutsch🇪🇸 Español🇮🇹 Italiano

Real estate price map


Real estate price map in the municipality of Bordères-Louron, choose a section to see transactions by parcel.

Hautes-Pyrénées (65)
Bordères-Louron

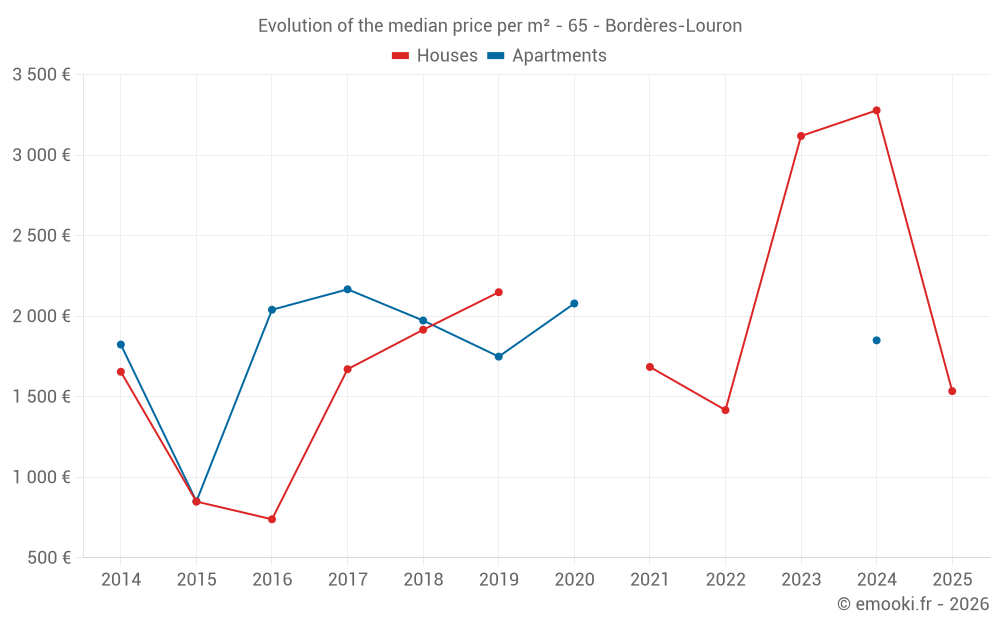
Median price of real estate
in the municipality of Bordères-Louron

HousesHouses
3 119  /m²
1-23-45-67-89-10
Reliability 5/10
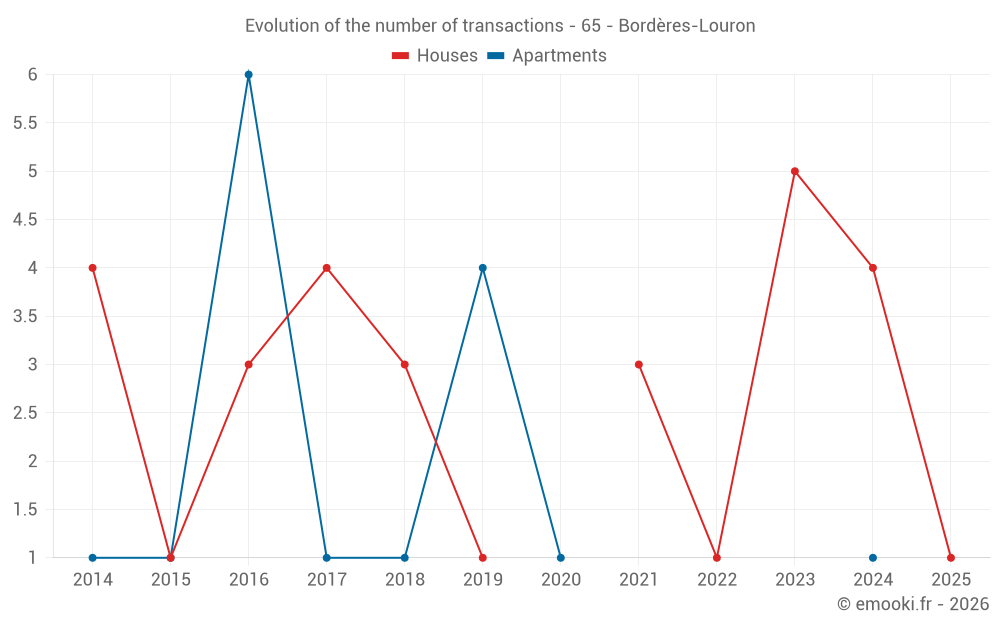
Median price on the 11 transactions of the last 48 months.
from 1 535 to
3 523  /m²
60% of transactions from the 2nd to the 8th deciles.
ApartmentsApartments
1 973  /m²
1-23-45-67-89-10
Reliability 2/10
Median price on the 7 transactions of the last 96 months.
DwellingsDwellings
2 704  /m²
1-23-45-67-89-10
Reliability 5/10
Median price on the 12 transactions of the last 48 months.
from 1 598 to
3 493  /m²
60% of transactions from the 2nd to the 8th deciles.

Yearly evolution

Evolution of the median price per m²

Evolution of the number of transactions

Warning, last year incomplete. Projections made based on the proportions between semesters of the previous year at the departmental/national level and by type of property.

Yearly data

Descending order
Year
Houses
house
transactions
Houses
house
Price per m²
Apartments
apt.
transactions
Apartments
apt.
Price per m²
2025
1
1 535 
0
--- 
2024
4
3 278 
1
1 850 
2023
5
3 119 
0
--- 
2022
1
1 417 
0
--- 
2021
3
1 685 
0
--- 
2020
0
--- 
1
2 079 
2019
1
2 149 
4
1 749 
2018
3
1 916 
1
1 973 
2017
4
1 671 
1
2 167 
2016
3
739 
6
2 040 
2015
1
849 
1
850 
2014
4
1 655 
1
1 824 

Analysis

Structure of prices per m²

Values of price percentiles per m² over the periods used for the estimated price of each type of property.

Structure of transaction amounts

Values of transaction amounts percentiles over the periods used for the estimated price of each type of property.

Transaction amounts and prices per m² by percentile

Ascending order
Percentile
Houses
house
Price per m²
Houses
house
Transaction amount
Apartments
apt.
Price per m²
Apartments
apt.
Transaction amount
10th percentile
1 417 
140 K
1 332 
106 K
20th percentile
1 535 
146 K
1 468 
127 K
30th percentile
2 169 
152 K
1 754 
137 K
40th percentile
2 288 
170 K
1 899 
143 K
50th percentile
3 119 
184 K
1 973 
148 K
60th percentile
3 184 
282 K
2 037 
158 K
70th percentile
3 371 
300 K
2 088 
169 K
80th percentile
3 523 
309 K
2 117 
181 K
90th percentile
3 883 
346 K
3 012 
198 K

National and departmental comparison

Evolution of the median price per m² of houses

Evolution of the median price per m² of apartments

Quarterly evolution

Evolution of the median price per m²

Evolution of the number of transactions

Quarterly data

Descending order
Quarter
Houses
house
transactions
Houses
house
Price per m²
Apartments
apt.
transactions
Apartments
apt.
Price per m²
2025 Q1
1
1 535 
0
--- 
2024 Q4
0
--- 
1
1 850 
2024 Q3
1
800 
0
--- 
2024 Q2
2
3 278 
0
--- 
2024 Q1
1
3 883 
0
--- 
2023 Q4
1
2 288 
0
--- 
2023 Q3
1
2 169 
0
--- 
2023 Q2
1
4 000 
0
--- 
2023 Q1
2
3 321 
0
--- 
2022 Q1
1
1 417 
0
--- 
2021 Q2
2
1 691 
0
--- 
2021 Q1
1
1 685 
0
--- 
2020 Q3
0
--- 
1
2 079 
2019 Q4
1
2 149 
1
2 126 
2019 Q3
0
--- 
2
2 857 
2019 Q2
0
--- 
1
1 273 
2018 Q4
2
2 076 
0
--- 
2018 Q3
1
955 
0
--- 
2018 Q2
0
--- 
1
1 973 
2017 Q2
0
--- 
1
2 167 
2017 Q1
4
1 671 
0
--- 
2016 Q3
0
--- 
2
2 250 
2016 Q2
0
--- 
2
1 845 
2016 Q1
3
739 
2
1 641 
2015 Q4
1
849 
0
--- 
2015 Q2
0
--- 
1
850 
2014 Q4
1
1 845 
0
--- 
2014 Q3
0
--- 
1
1 824 
2014 Q2
2
1 655 
0
--- 
2014 Q1
1
592 
0
--- 

Overview of the latest real estate transactions

The following list is an anonymized overview of the latest transactions. For more details and to find all transactions, please use the map to view transactions by plot or the transaction search page for a search by criteria.

2025-06-24
7 000 
Sale
Land
3763 m2
-Landes
/Pâture plantée
2025-06-05
3 213 
Sale
Land
1890 m2
-Taillis simples
2025-03-31
184 210 
1 535  /m²(120 m²)
Sale
Houses
House
3 rooms
120 m2
Land
137 m2
-Sols
Land
6400 m2
-Prés
2024-12-20
185 000 
1 850  /m²(100 m²)
Sale
Apartments
Apartment
4 rooms
100 m2
1 outbuilding
Land
1146 m2
-Prés
Land
51 m2
-Prés
2024-10-31
7 360 
Sale
Land
3606 m2
-Prés
Land
320 m2
-Prés
Land
1502 m2
-Landes
/Pâture plantée
Land
1300 m2
-Landes
/Friche
Land
1511 m2
-Prés
Land
1008 m2
-Landes
/Friche
Land
731 m2
-Landes
/Pâture plantée
Land
2851 m2
-Taillis simples
Land
910 m2
-Landes
/Pâture plantée
Land
980 m2
-Landes
/Friche
2024-10-21
9 100 
Sale
Land
91 m2
-Sols
2024-10-16
40 000 
Sale
Land
1750 m2
-Futaies feuillues
/CHENE
2024-10-08
75 000 
Sale
Land
679 m2
-Terres
2024-09-30
80 000 
800  /m²(100 m²)
Sale
Houses
House
2 rooms
100 m2
Land
89 m2
-Sols
Land
610 m2
-Landes
/Friche
2024-09-30
11 
Sale
Land
49 m2
-Landes
/Pâture plantée
2024-09-13
30 000 
Sale
Land
1039 m2
-Sols
Land
1195 m2
-Landes
/Pâture plantée
Land
2280 m2
-Taillis simples
Land
15210 m2
-Prés
2024-07-12
24 
Sale
Land
113 m2
-Landes
/Friche
2024-07-04
69 000 
Sale
Land
357 m2
-Terres
Land
265 m2
-Landes
/Pâture plantée
2024-07-02
16 
Sale
Land
73 m2
-Landes
/Pâture plantée
2024-06-17
300 000 
3 371  /m²(89 m²)
Sale
Houses
House
4 rooms
89 m2
2 outbuildings
Land
409 m2
-Sols
2024-06-03
58 500 
Sale
Land
346 m2
-Jardins
Land
230 m2
-Sols
2024-05-29
146 460 
3 184  /m²(46 m²)
Sale
Houses
House
3 rooms
46 m2
Land
43 m2
-Sols
2024-05-27
72 500 
Sale
Land
600 m2
-Terres
2024-05-23
4 200 
Sale
Land
1427 m2
-Prés
2024-04-30
57 500 
Sale
Land
661 m2
-Prés

Hautes-Pyrénées (65)

Most expensive cities

City
name
Descending orderHouses
house
Price per m²
4 315 
3 974 
3 548 
3 375 
3 300 
3 216 
3 205 
3 119 
3 080 
City
name
Descending orderApartments
apt.
Price per m²
5 224 
3 906 
3 772 
3 380 
3 323 
3 321 
3 128 
3 116 
3 000 

Least expensive cities

City
name
Ascending orderHouses
house
Price per m²
508 
536 
566 
571 
642 
654 
674 
676 
City
name
Ascending orderApartments
apt.
Price per m²
76 
224 
333 
341 
370 
462 
500 
502