Median price of real estate
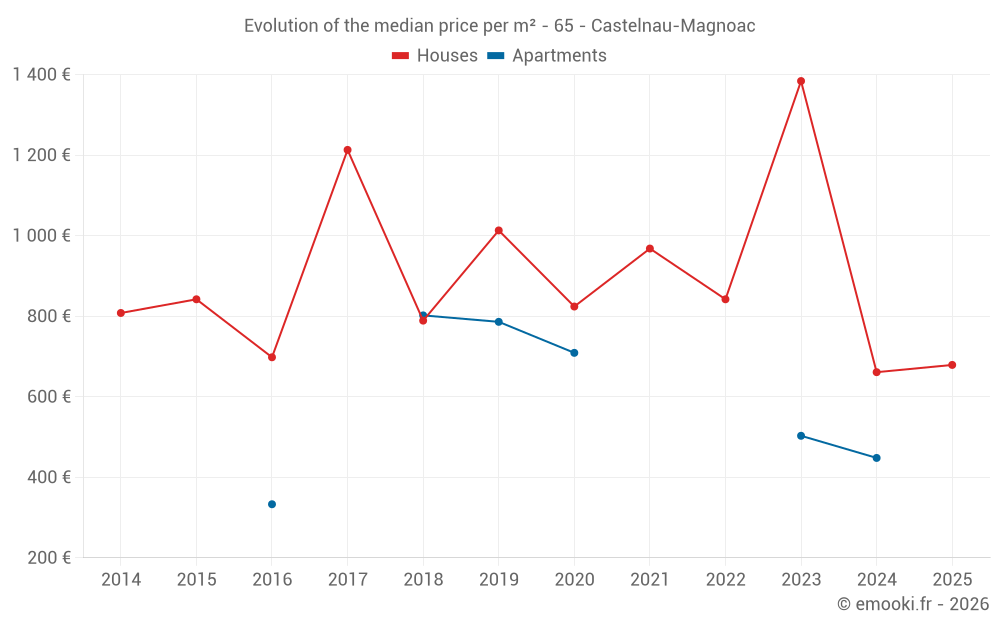
in the municipality of Castelnau-Magnoac
Houses
842 € /m²
Reliability 7/10
Median price on the 20 transactions of the last 24 months.
from 528 to
2 181 € /m²
2 181 € /m²
60% of transactions from the 2nd to the 8th deciles.
Apartments
589 € /m²
Reliability 2/10
Median price on the 8 transactions of the last 96 months.
Dwellings
726 € /m²
Reliability 7/10
Median price on the 22 transactions of the last 24 months.
from 462 to
2 127 € /m²
2 127 € /m²
60% of transactions from the 2nd to the 8th deciles.