emooki
HomePrice mapTransactions
🇬🇧 English🇫🇷 Français🇩🇪 Deutsch🇪🇸 Español🇮🇹 Italiano

Real estate price map


Real estate price map in the municipality of Arrens-Marsous, choose a section to see transactions by parcel.

Hautes-Pyrénées (65)

Arrens-Marsous - Real estate price m²

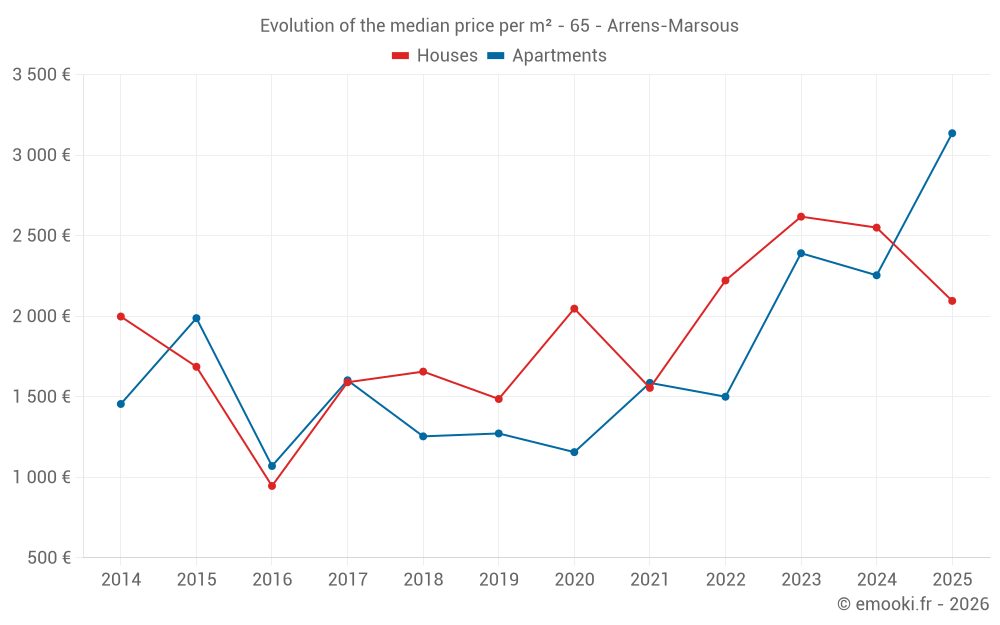
Median price of real estate
in the municipality of Arrens-Marsous

HousesHouses
2 470  /m²
1-23-45-67-89-10
Reliability 7/10
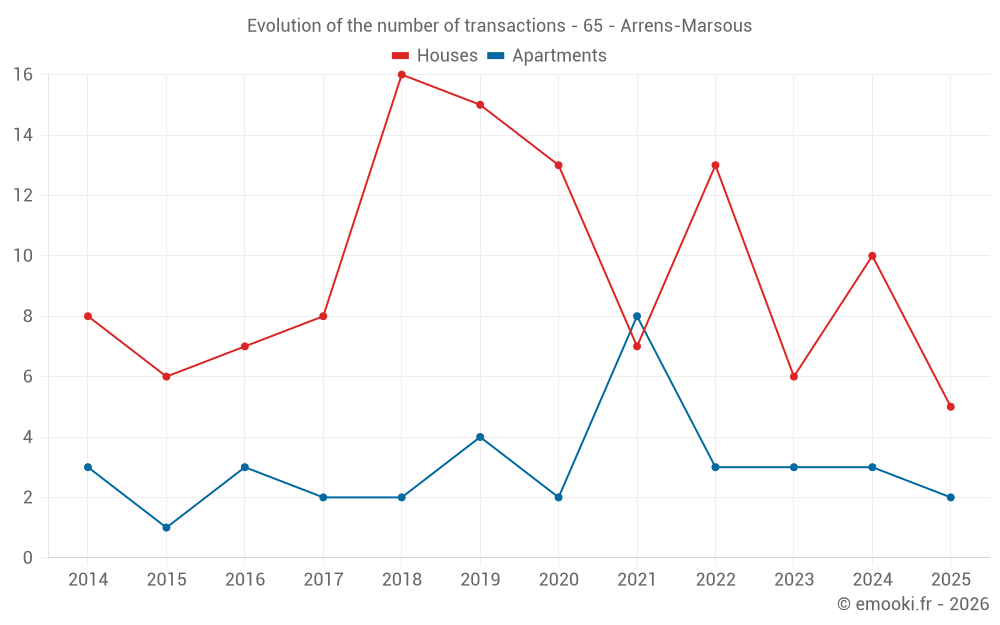
Median price on the 20 transactions of the last 24 months.
from 1 838 to
2 889  /m²
60% of transactions from the 2nd to the 8th deciles.
ApartmentsApartments
1 933  /m²
1-23-45-67-89-10
Reliability 5/10
Median price on the 15 transactions of the last 48 months.
from 1 428 to
2 440  /m²
60% of transactions from the 2nd to the 8th deciles.
DwellingsDwellings
2 288  /m²
1-23-45-67-89-10
Reliability 8/10
Median price on the 16 transactions of the last 12 months.
from 1 500 to
2 813  /m²
60% of transactions from the 2nd to the 8th deciles.
HousesEvolution of the price per m² of houses since...
1 year
-18%
2 years
-20%
3 years
-5.7%
4 years
+35%
5 years
+2.3%
6 years
+41%
7 years
+27%
8 years
+32%
9 years
+121%
10 years
+24%
11 years
+4.9%
The price per m² of houses has decreased by 20% since 2 years, but it has increased by 121% in 9 years.

Yearly evolution

Evolution of the median price per m²

Evolution of the median price per m² - 65 - Arrens-Marsous

Evolution of the number of transactions

Warning, last year incomplete. Projections made based on the proportions between semesters of the previous year at the departmental/national level and by type of property.

Evolution of the number of transactions - 65 - Arrens-Marsous

Yearly data

Descending order
Year
Houses
house
transactions
Houses
house
Price per m²
Apartments
apt.
transactions
Apartments
apt.
Price per m²
2025
5
2 095 
2
3 136 
2024
10
2 550 
3
2 254 
2023
6
2 618 
3
2 391 
2022
13
2 222 
3
1 500 
2021
7
1 555 
8
1 586 
2020
13
2 047 
2
1 156 
2019
15
1 486 
4
1 272 
2018
16
1 656 
2
1 254 
2017
8
1 590 
2
1 602 
2016
7
946 
3
1 070 
2015
6
1 686 
1
1 988 
2014
8
1 998 
3
1 455 

Analysis

Structure of prices per m²

Values of price percentiles per m² over the periods used for the estimated price of each type of property.

Structure of transaction amounts

Values of transaction amounts percentiles over the periods used for the estimated price of each type of property.

Transaction amounts and prices per m² by percentile

Ascending order
Percentile
Houses
house
Price per m²
Houses
house
Transaction amount
Apartments
apt.
Price per m²
Apartments
apt.
Transaction amount
10th percentile
1 493 
114 K
1 237 
51 268 
20th percentile
1 838 
131 K
1 428 
59 000 
30th percentile
2 016 
176 K
1 543 
64 234 
40th percentile
2 088 
200 K
1 822 
152 K
50th percentile
2 470 
222 K
1 933 
205 K
60th percentile
2 623 
245 K
2 162 
210 K
70th percentile
2 772 
258 K
2 364 
236 K
80th percentile
2 889 
278 K
2 440 
297 K
90th percentile
3 164 
323 K
2 680 
373 K

National and departmental comparison

Evolution of the median price per m² of houses

Evolution of the median price per m² of apartments

Quarterly evolution

Evolution of the median price per m²

Evolution of the number of transactions

Quarterly data

Descending order
Quarter
Houses
house
transactions
Houses
house
Price per m²
Apartments
apt.
transactions
Apartments
apt.
Price per m²
2025 Q2
3
2 095 
1
4 845 
2025 Q1
2
1 854 
1
1 426 
2024 Q3
8
2 550 
1
1 933 
2024 Q2
2
2 529 
1
2 439 
2024 Q1
0
--- 
1
2 254 
2023 Q4
2
2 480 
1
2 838 
2023 Q3
3
2 459 
1
2 391 
2023 Q2
1
2 778 
0
--- 
2023 Q1
0
--- 
1
1 714 
2022 Q4
5
1 214 
2
1 800 
2022 Q3
2
2 808 
1
1 111 
2022 Q2
3
2 381 
0
--- 
2022 Q1
3
1 678 
0
--- 
2021 Q4
4
1 884 
3
1 894 
2021 Q3
1
2 571 
1
1 429 
2021 Q2
2
1 235 
2
1 656 
2021 Q1
0
--- 
2
1 380 
2020 Q4
5
2 077 
1
1 725 
2020 Q3
3
1 586 
1
588 
2020 Q2
2
2 262 
0
--- 
2020 Q1
3
1 410 
0
--- 
2019 Q4
2
1 292 
2
875 
2019 Q3
6
1 892 
1
1 293 
2019 Q2
4
1 104 
1
1 510 
2019 Q1
3
1 851 
0
--- 
2018 Q4
8
1 556 
1
1 452 
2018 Q3
1
2 250 
0
--- 
2018 Q2
4
1 590 
0
--- 
2018 Q1
3
1 846 
1
1 056 
2017 Q4
3
1 708 
1
2 048 
2017 Q3
1
1 300 
0
--- 
2017 Q2
2
1 766 
1
1 156 
2017 Q1
2
1 363 
0
--- 
2016 Q4
2
1 100 
1
1 070 
2016 Q3
2
1 153 
1
1 033 
2016 Q2
3
946 
0
--- 
2016 Q1
0
--- 
1
1 250 
2015 Q4
2
1 370 
1
1 988 
2015 Q2
3
2 085 
0
--- 
2015 Q1
1
1 490 
0
--- 
2014 Q4
3
2 411 
0
--- 
2014 Q3
1
2 150 
0
--- 
2014 Q2
2
1 486 
3
1 455 
2014 Q1
2
1 272 
0
--- 

Overview of the latest real estate transactions

The following list is an anonymized overview of the latest transactions. For more details and to find all transactions, please use the map to view transactions by plot or the transaction search page for a search by criteria.

2025-06-17
116 440 
3 234  /m²(36 m²)
Sale
Houses
House
3 rooms
36 m2
1 outbuilding
2025-06-05
416 650 
4 845  /m²(86 m²)
Sale
Apartments
Apartment
5 rooms
86 m2
1 outbuilding
Land
174 m2
-Sols
Land
4036 m2
-Prés
2025-05-26
600 
Sale
Land
2011 m2
-Taillis simples
2025-05-20
205 850 
1 583  /m²(130 m²)
Sale
Houses
House
4 rooms
130 m2
Land
89 m2
-Sols
2025-05-14
152 950 
2 095  /m²(73 m²)
Sale
Houses
House
3 rooms
73 m2
Land
188 m2
-Sols
2025-03-28
394 000 
2 627  /m²(150 m²)
Sale
Houses
House
5 rooms
150 m2
Land
971 m2
-Sols
Land
2834 m2
-Landes
/Pâture plantée
Land
882 m2
-Landes
/Pâture plantée
Land
3812 m2
-Landes
/Pâture plantée
Land
1035 m2
-Taillis simples
Land
444 m2
-Taillis simples
Land
441 m2
-Landes
/Pâture plantée
Land
5682 m2
-Landes
/Pâture plantée
2025-03-26
10 000 
Sale
Land
7393 m2
-Futaies feuillues
/Hêtres
Land
13923 m2
-Futaies feuillues
/Hêtres
Land
28820 m2
-Landes
/Pâture plantée
2025-03-25
95 000 
1 080  /m²(88 m²)
Sale
Houses
House
3 rooms
88 m2
Land
102 m2
-Sols
Land
119 m2
-Landes
/Pâture plantée
2025-03-20
1 
Sale
Land
92 m2
-Taillis simples
2025-03-20
1 000 
Sale
Land
188 m2
-Taillis simples
2025-02-21
242 470 
1 426  /m²(170 m²)
Sale
Apartments
Apartment
5 rooms
90 m2
Apartments
Apartment
3 rooms
80 m2
2 outbuildings
Land
344 m2
-Sols
2025-02-21
60 000 
Sale
Land
209 m2
-Sols
Land
1084 m2
-Prés
2025-02-14
2 200 
Sale
Land
6312 m2
-Taillis simples
Land
1094 m2
-Landes
/Pâture plantée
2025-01-29
40 000 
Sale
Land
1940 m2
-Prés
Land
98 m2
-Sols
Land
142 m2
-Prés
Land
4808 m2
-Prés
2024-12-30
500 
Exchange
Land
7 m2
-Sols
Land
237 m2
-Prés
2024-12-12
3 000 
Sale
Land
7617 m2
-Prés
2024-11-15
13 558 
Sale
Land
2250 m2
-Landes
/Pâture plantée
Land
1647 m2
-Taillis simples
Land
126 m2
-Sols
Land
9535 m2
-Prés
2024-11-04
5 750 
Sale
Land
3300 m2
-Landes
/Pâture plantée
Land
7839 m2
-Landes
/Pâture plantée
Land
263 m2
-Landes
/Pâture plantée
Land
3337 m2
-Landes
/Pâture plantée
2024-10-25
500 
Sale
Land
1290 m2
-Prés
2024-10-01
50 000 
Sale
1 outbuilding
Land
52 m2
-Sols
Land
227 m2
-Sols
336 transactions listed in the municipality

Hautes-Pyrénées (65)

Most expensive cities

City
name
Descending orderHouses
house
Price per m²
4 315 
3 974 
3 548 
3 375 
3 300 
3 216 
3 205 
3 119 
3 080 
City
name
Descending orderApartments
apt.
Price per m²
5 224 
3 906 
3 772 
3 380 
3 323 
3 321 
3 128 
3 116 
3 000 

Least expensive cities

City
name
Ascending orderHouses
house
Price per m²
508 
536 
566 
571 
642 
654 
674 
676 
City
name
Ascending orderApartments
apt.
Price per m²
76 
224 
333 
341 
370 
462 
500 
502