emooki
HomePrice mapTransactions
🇬🇧 English🇫🇷 Français🇩🇪 Deutsch🇪🇸 Español🇮🇹 Italiano

Real estate price map


Real estate price map in the municipality of Lourdes.

Hautes-Pyrénées (65)
Lourdes

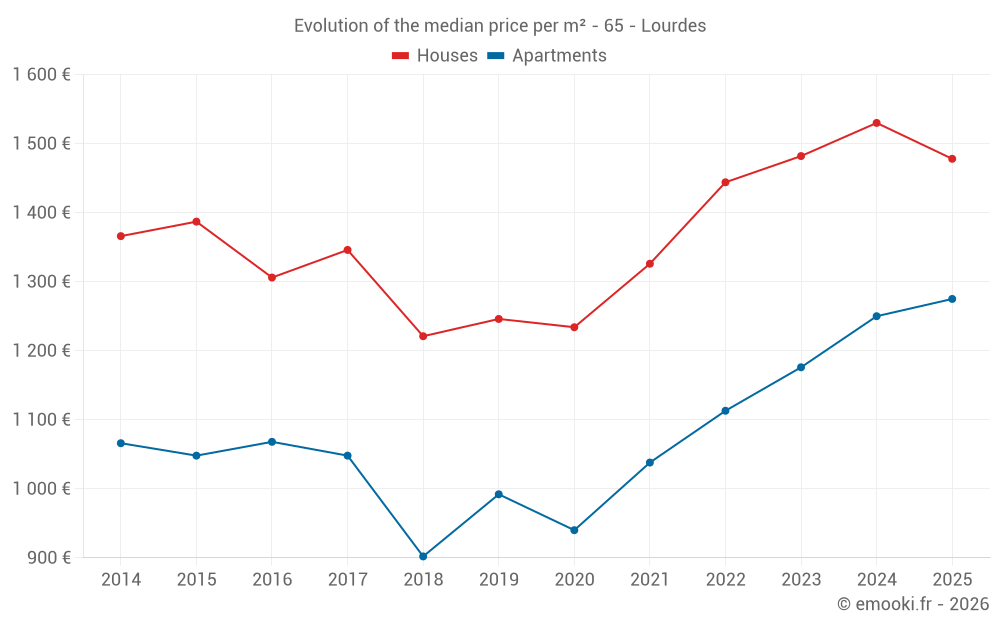
Median price of real estate
in the municipality of Lourdes

HousesHouses
1 478 € /m²
1-23-45-67-89-10
Reliability 9/10
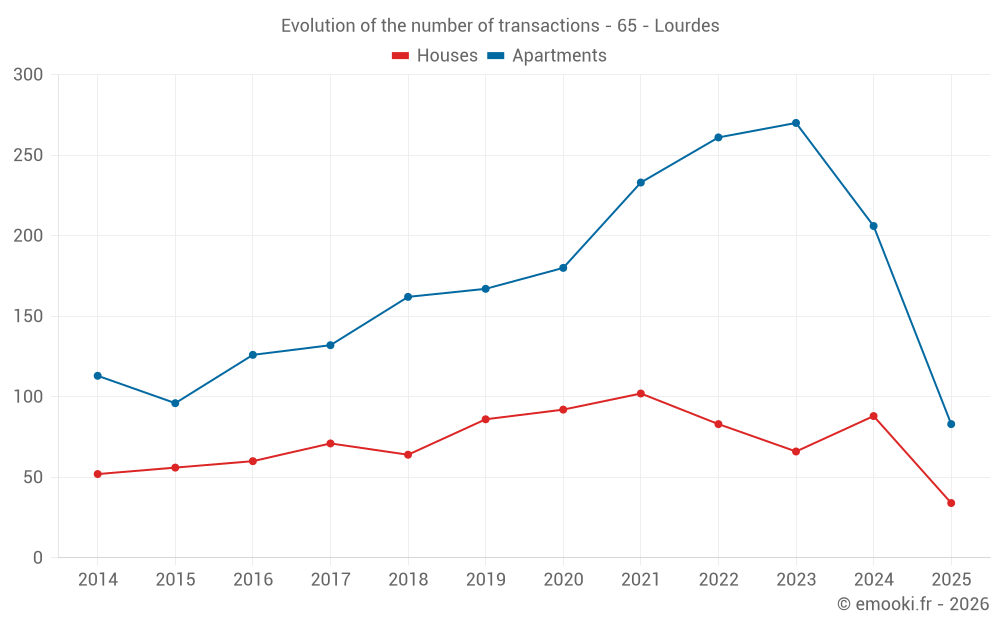
Median price on the 34 transactions of the last 6 months.
from 1 173 to
2 103 € /m²
60% of transactions from the 2nd to the 8th deciles.
ApartmentsApartments
1 306 € /m²
1-23-45-67-89-10
Reliability 10/10
Median price on the 48 transactions of the last 3 months.
from 856 to
1 696 € /m²
60% of transactions from the 2nd to the 8th deciles.
DwellingsDwellings
1 261 € /m²
1-23-45-67-89-10
Reliability 10/10
Median price on the 65 transactions of the last 3 months.
from 875 to
1 771 € /m²
60% of transactions from the 2nd to the 8th deciles.
HousesEvolution of the price per m² of houses since...
1 year
-3.4%
2 years
-0.3%
3 years
+2.4%
4 years
+11%
5 years
+20%
6 years
+19%
7 years
+21%
8 years
+10%
9 years
+13%
10 years
+6.6%
11 years
+8.2%
ApartmentsEvolution of the price per m² of apartments since...
1 year
+2%
2 years
+8.4%
3 years
+15%
4 years
+23%
5 years
+36%
6 years
+29%
7 years
+41%
8 years
+22%
9 years
+19%
10 years
+22%
11 years
+20%

Yearly evolution

Evolution of the median price per m²

Evolution of the number of transactions

Warning, last year incomplete. Projections made based on the proportions between semesters of the previous year at the departmental/national level and by type of property.

Yearly data

Descending order
Year
Houses
house
transactions
Houses
house
Price per m²
Apartments
apt.
transactions
Apartments
apt.
Price per m²
2025
34
1 478 €
83
1 275 €
2024
88
1 530 €
206
1 250 €
2023
66
1 482 €
270
1 176 €
2022
83
1 444 €
261
1 113 €
2021
102
1 326 €
233
1 038 €
2020
92
1 234 €
180
940 €
2019
86
1 246 €
167
992 €
2018
64
1 221 €
162
902 €
2017
71
1 346 €
132
1 048 €
2016
60
1 306 €
126
1 068 €
2015
56
1 387 €
96
1 048 €
2014
52
1 366 €
113
1 066 €

Analysis

Structure of prices per m²

Values of price percentiles per m² over the periods used for the estimated price of each type of property.

Structure of transaction amounts

Values of transaction amounts percentiles over the periods used for the estimated price of each type of property.

Transaction amounts and prices per m² by percentile

Ascending order
Percentile
Houses
house
Price per m²
Houses
house
Transaction amount
Apartments
apt.
Price per m²
Apartments
apt.
Transaction amount
10th percentile
896 €
87 656 €
681 €
35 000 €
20th percentile
1 173 €
115 K€
856 €
47 660 €
30th percentile
1 246 €
127 K€
1 020 €
58 200 €
40th percentile
1 277 €
145 K€
1 112 €
65 000 €
50th percentile
1 478 €
172 K€
1 306 €
72 100 €
60th percentile
1 608 €
185 K€
1 424 €
80 400 €
70th percentile
1 803 €
200 K€
1 472 €
99 950 €
80th percentile
2 103 €
224 K€
1 696 €
125 K€
90th percentile
2 470 €
290 K€
2 032 €
170 K€

National and departmental comparison

Evolution of the median price per m² of houses

Evolution of the median price per m² of apartments

Quarterly evolution

Evolution of the median price per m²

Evolution of the number of transactions

Quarterly data

Descending order
Quarter
Houses
house
transactions
Houses
house
Price per m²
Apartments
apt.
transactions
Apartments
apt.
Price per m²
2025 Q2
17
1 250 €
48
1 306 €
2025 Q1
17
1 496 €
35
1 235 €
2024 Q4
28
1 546 €
68
1 259 €
2024 Q3
23
1 616 €
51
1 281 €
2024 Q2
24
1 354 €
49
1 235 €
2024 Q1
13
1 509 €
38
1 212 €
2023 Q4
13
1 350 €
49
1 167 €
2023 Q3
20
1 464 €
60
1 280 €
2023 Q2
14
1 712 €
82
1 196 €
2023 Q1
19
1 442 €
79
1 038 €
2022 Q4
25
1 444 €
67
1 153 €
2022 Q3
24
1 690 €
74
1 112 €
2022 Q2
15
1 123 €
62
1 086 €
2022 Q1
19
1 259 €
58
1 100 €
2021 Q4
27
1 351 €
58
1 097 €
2021 Q3
29
1 359 €
71
1 070 €
2021 Q2
28
1 017 €
57
998 €
2021 Q1
18
1 232 €
47
1 000 €
2020 Q4
26
1 274 €
50
868 €
2020 Q3
23
1 189 €
44
1 028 €
2020 Q2
23
1 280 €
41
1 000 €
2020 Q1
20
1 231 €
45
951 €
2019 Q4
26
1 235 €
43
1 042 €
2019 Q3
15
924 €
33
891 €
2019 Q2
17
1 151 €
35
1 000 €
2019 Q1
28
1 340 €
56
1 037 €
2018 Q4
15
1 321 €
39
963 €
2018 Q3
20
1 127 €
41
930 €
2018 Q2
14
1 034 €
43
867 €
2018 Q1
15
1 399 €
39
973 €
2017 Q4
19
1 417 €
28
1 001 €
2017 Q3
12
1 186 €
37
1 107 €
2017 Q2
20
1 304 €
35
1 059 €
2017 Q1
20
1 471 €
32
1 000 €
2016 Q4
18
1 008 €
33
1 100 €
2016 Q3
16
1 519 €
31
1 007 €
2016 Q2
16
1 324 €
30
1 046 €
2016 Q1
10
1 301 €
32
988 €
2015 Q4
14
1 464 €
21
904 €
2015 Q3
16
1 308 €
28
1 017 €
2015 Q2
10
821 €
28
1 070 €
2015 Q1
16
1 459 €
19
1 076 €
2014 Q4
11
1 354 €
31
1 232 €
2014 Q3
12
1 502 €
28
993 €
2014 Q2
13
1 173 €
29
982 €
2014 Q1
16
1 569 €
25
1 016 €

Hautes-Pyrénées (65)

Most expensive cities

City
name
Descending orderHouses
house
Price per m²
4 315 €
3 974 €
3 700 €
3 548 €
3 375 €
3 300 €
3 216 €
3 205 €
3 119 €
3 080 €
City
name
Descending orderApartments
apt.
Price per m²
5 224 €
3 906 €
3 772 €
3 380 €
3 323 €
3 321 €
3 128 €
3 116 €
3 043 €
3 000 €

Least expensive cities

City
name
Ascending orderHouses
house
Price per m²
217 €
508 €
536 €
566 €
571 €
642 €
654 €
654 €
674 €
676 €
City
name
Ascending orderApartments
apt.
Price per m²
76 €
224 €
308 €
333 €
341 €
370 €
455 €
462 €
500 €
502 €