emooki
HomePrice mapTransactions
🇬🇧 English🇫🇷 Français🇩🇪 Deutsch🇪🇸 Español🇮🇹 Italiano

Real estate price map


Real estate price map in the municipality of Saint-Paul-lès-Durance, choose a section to see transactions by parcel.

Bouches-du-Rhône (13)
Saint-Paul-lès-Durance

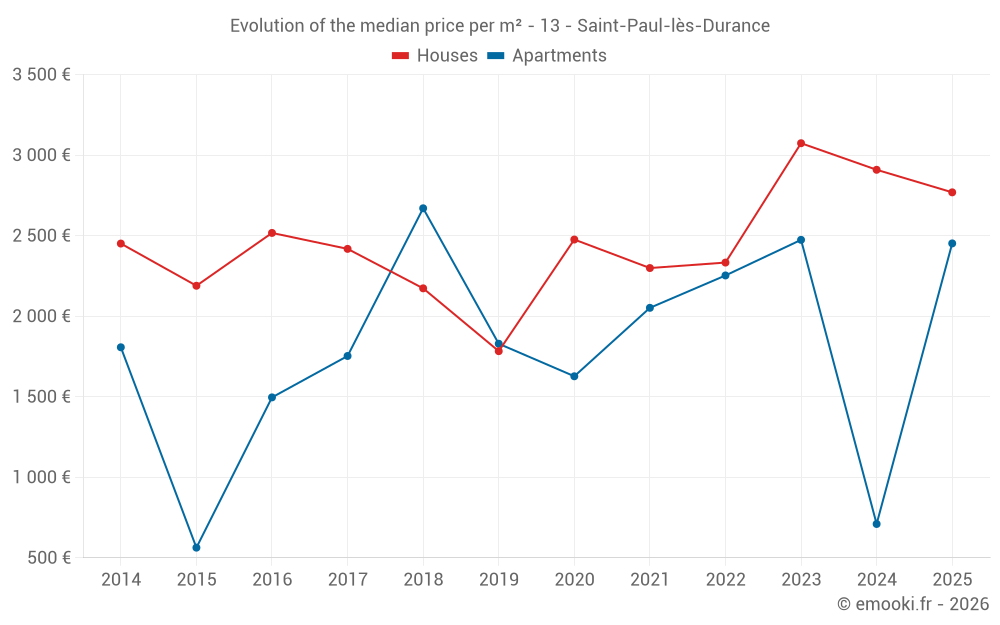
Median price of real estate
in the municipality of Saint-Paul-lès-Durance

HousesHouses
2 931  /m²
1-23-45-67-89-10
Reliability 6/10
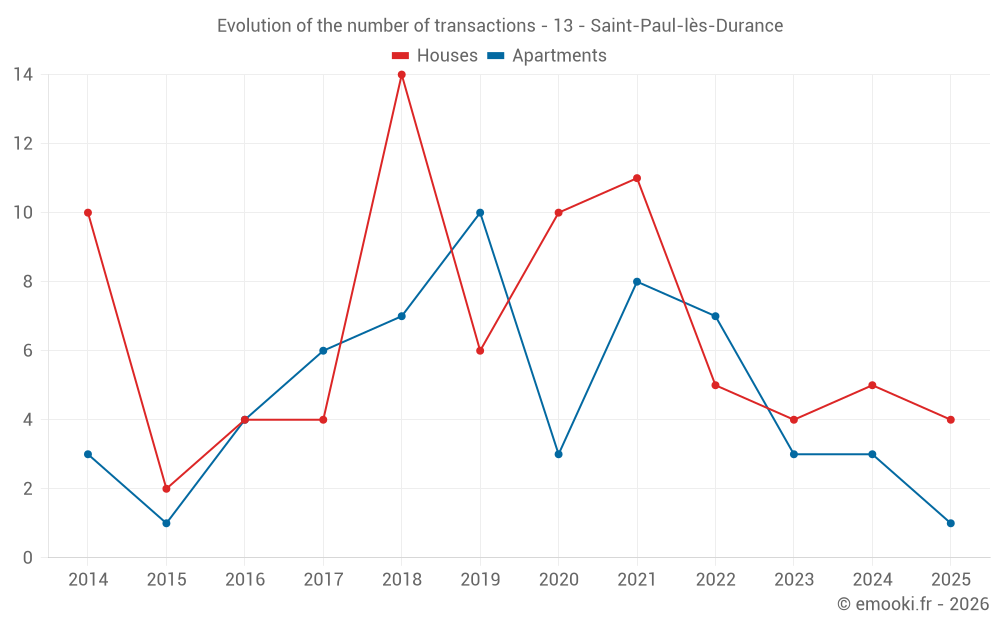
Median price on the 15 transactions of the last 36 months.
from 2 189 to
3 516  /m²
60% of transactions from the 2nd to the 8th deciles.
ApartmentsApartments
2 376  /m²
1-23-45-67-89-10
Reliability 6/10
Median price on the 12 transactions of the last 36 months.
from 1 481 to
2 668  /m²
60% of transactions from the 2nd to the 8th deciles.
DwellingsDwellings
2 472  /m²
1-23-45-67-89-10
Reliability 7/10
Median price on the 16 transactions of the last 24 months.
from 1 417 to
2 985  /m²
60% of transactions from the 2nd to the 8th deciles.
HousesEvolution of the price per m² of houses since...
1 year
-4.8%
2 years
-10%
3 years
+19%
4 years
+20%
5 years
+12%
6 years
+55%
7 years
+27%
8 years
+15%
9 years
+10%
10 years
--
11 years
+13%
The price per m² of houses has decreased by 10% since 2 years, but it has increased by 55% in 6 years.

Yearly evolution

Evolution of the median price per m²

Evolution of the number of transactions

Warning, last year incomplete. Projections made based on the proportions between semesters of the previous year at the departmental/national level and by type of property.

Yearly data

Descending order
Year
Houses
house
transactions
Houses
house
Price per m²
Apartments
apt.
transactions
Apartments
apt.
Price per m²
2025
4
2 769 
1
2 452 
2024
5
2 909 
3
710 
2023
4
3 074 
3
2 474 
2022
5
2 333 
7
2 253 
2021
11
2 299 
8
2 052 
2020
10
2 476 
3
1 627 
2019
6
1 783 
10
1 829 
2018
14
2 173 
7
2 670 
2017
4
2 418 
6
1 753 
2016
4
2 517 
4
1 496 
2015
2
2 189 
1
563 
2014
10
2 451 
3
1 807 

Analysis

Structure of prices per m²

Values of price percentiles per m² over the periods used for the estimated price of each type of property.

Structure of transaction amounts

Values of transaction amounts percentiles over the periods used for the estimated price of each type of property.

Transaction amounts and prices per m² by percentile

Ascending order
Percentile
Houses
house
Price per m²
Houses
house
Transaction amount
Apartments
apt.
Price per m²
Apartments
apt.
Transaction amount
10th percentile
1 965 
139 K
781 
76 153 
20th percentile
2 189 
160 K
1 481 
89 176 
30th percentile
2 475 
192 K
1 891 
113 K
40th percentile
2 742 
197 K
2 272 
130 K
50th percentile
2 931 
215 K
2 376 
142 K
60th percentile
3 018 
288 K
2 465 
162 K
70th percentile
3 188 
318 K
2 496 
169 K
80th percentile
3 516 
357 K
2 668 
184 K
90th percentile
4 158 
416 K
2 767 
202 K

National and departmental comparison

Evolution of the median price per m² of houses

Evolution of the median price per m² of apartments

Quarterly evolution

Evolution of the median price per m²

Evolution of the number of transactions

Quarterly data

Descending order
Quarter
Houses
house
transactions
Houses
house
Price per m²
Apartments
apt.
transactions
Apartments
apt.
Price per m²
2025 Q2
2
2 752 
1
2 452 
2025 Q1
2
2 769 
0
--- 
2024 Q4
2
2 570 
1
500 
2024 Q3
1
1 181 
0
--- 
2024 Q2
0
--- 
2
1 064 
2024 Q1
2
3 322 
0
--- 
2023 Q3
1
2 491 
2
2 490 
2023 Q2
1
2 931 
0
--- 
2023 Q1
2
4 774 
1
2 301 
2022 Q4
2
3 208 
1
2 833 
2022 Q3
0
--- 
4
2 480 
2022 Q2
2
1 930 
0
--- 
2022 Q1
1
4 544 
2
1 966 
2021 Q4
3
2 299 
5
1 972 
2021 Q3
4
2 432 
3
2 131 
2021 Q2
3
1 750 
0
--- 
2021 Q1
1
4 091 
0
--- 
2020 Q4
2
2 623 
0
--- 
2020 Q3
4
1 972 
2
1 643 
2020 Q2
3
2 643 
0
--- 
2020 Q1
1
3 014 
1
1 627 
2019 Q4
0
--- 
3
1 650 
2019 Q3
2
1 682 
2
1 930 
2019 Q2
0
--- 
2
1 924 
2019 Q1
4
1 783 
3
1 625 
2018 Q4
7
2 144 
1
2 808 
2018 Q3
5
2 662 
0
--- 
2018 Q2
2
1 674 
5
2 670 
2018 Q1
0
--- 
1
1 882 
2017 Q4
1
2 389 
0
--- 
2017 Q3
3
2 448 
4
1 650 
2017 Q1
0
--- 
2
1 935 
2016 Q4
0
--- 
2
1 372 
2016 Q3
4
2 517 
1
1 944 
2016 Q1
0
--- 
1
1 111 
2015 Q4
1
1 542 
0
--- 
2015 Q3
1
2 836 
0
--- 
2015 Q1
0
--- 
1
563 
2014 Q4
2
2 394 
2
1 854 
2014 Q3
4
2 764 
0
--- 
2014 Q2
3
2 463 
0
--- 
2014 Q1
1
2 063 
1
1 286 

Overview of the latest real estate transactions

The following list is an anonymized overview of the latest transactions. For more details and to find all transactions, please use the map to view transactions by plot or the transaction search page for a search by criteria.

2025-06-26
150 000 
157  /m²(956 m²)
Sale
Commercial property
601 m2
Commercial property
355 m2
Land
1558 m2
-Sols
2025-05-28
355 000 
3 480  /m²(102 m²)
Sale
Houses
House
4 rooms
102 m2
Land
608 m2
-Sols
2025-05-28
203 550 
2 452  /m²(83 m²)
Sale
Apartments
Apartment
4 rooms
83 m2
2 outbuildings
1 outbuilding
2025-05-20
15 000 
Sale
Land
4184 m2
-Terres
Land
2655 m2
-Terres
Land
221 m2
-Landes
2025-05-20
1 485 000 
2 346  /m²(633 m²)
8 115  /m²(183 m²)
Sale
Houses
House
3 rooms
133 m2
Houses
House
2 rooms
50 m2
Commercial property
450 m2
Land
2500 m2
-Sols
Land
5054 m2
-Terres
Land
1010 m2
-Landes
2025-05-14
800 
Exchange
Land
4510 m2
-Taillis simples
Land
4200 m2
-Taillis simples
Land
3638 m2
-Landes
Land
2685 m2
-Taillis simples
2025-05-06
141 740 
2 025  /m²(70 m²)
Sale
Houses
House
4 rooms
70 m2
Land
127 m2
-Sols
2025-04-17
28 000 
966  /m²(29 m²)
Sale
Commercial property
29 m2
2025-03-28
322 000 
3 067  /m²(105 m²)
Sale
Houses
House
4 rooms
105 m2
Land
618 m2
-Sols
2025-03-21
215 000 
2 471  /m²(87 m²)
Sale
Houses
House
3 rooms
87 m2
Land
59 m2
-Sols
2025-01-29
32 683 
1 089  /m²(30 m²)
Sale
Commercial property
30 m2
2024-12-03
192 000 
2 909  /m²(66 m²)
Sale
Apartments
Apartment
1 room
12 m2
1 outbuilding
Houses
House
4 rooms
54 m2
Land
38 m2
-Sols
2024-11-27
3 500 
Sale
Land
15 m2
-Sols
Land
13 m2
-Sols
Land
7 m2
-Sols
2024-11-26
280 000 
848  /m²(330 m²)
Sale
Commercial property
330 m2
Land
1543 m2
-Sols
2024-10-24
165 000 
2 230  /m²(74 m²)
Sale
Land
9 m2
-Landes
Houses
House
3 rooms
74 m2
Land
60 m2
-Sols
Land
9 m2
-Sols
2024-10-18
20 000 
500  /m²(40 m²)
Sale
Apartments
Apartment
2 rooms
40 m2
1 outbuilding
2024-10-14
26 600 
858  /m²(31 m²)
Sale
Commercial property
31 m2
2024-10-10
157 000 
Sale
2 outbuildings
Land
52 m2
-Sols
2024-09-10
2 300 
Sale
Land
17480 m2
-Taillis simples
Land
10540 m2
-Landes
2024-08-22
85 000 
1 181  /m²(72 m²)
Sale
Houses
House
4 rooms
72 m2
Land
76 m2
-Sols

Bouches-du-Rhône (13)

Most expensive cities

City
name
Descending orderHouses
house
Price per m²
9 500 
8 239 
7 336 
6 791 
City
name
Descending orderApartments
apt.
Price per m²
7 274 
7 009 
5 908 
5 274 
5 022 
4 950 

Least expensive cities

City
name
Ascending orderHouses
house
Price per m²
2 212 
2 338 
2 513 
2 574 
2 692 
2 756 
2 786 
2 865 
City
name
Ascending orderApartments
apt.
Price per m²
1 500 
1 655 
1 730 
1 806 
1 838