emooki
HomePrice mapTransactions
🇬🇧 English🇫🇷 Français🇩🇪 Deutsch🇪🇸 Español🇮🇹 Italiano

Real estate price map


Real estate price map in the municipality of Charleval, choose a section to see transactions by parcel.

Bouches-du-Rhône (13)

Charleval - Real estate price m²

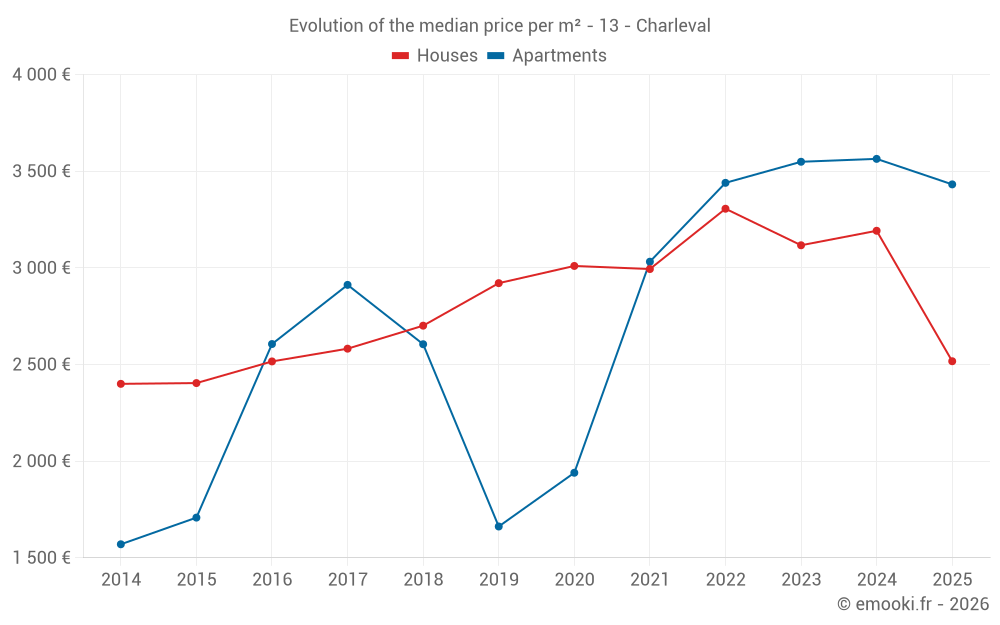
Median price of real estate
in the municipality of Charleval

HousesHouses
2 756  /m²
1-23-45-67-89-10
Reliability 8/10
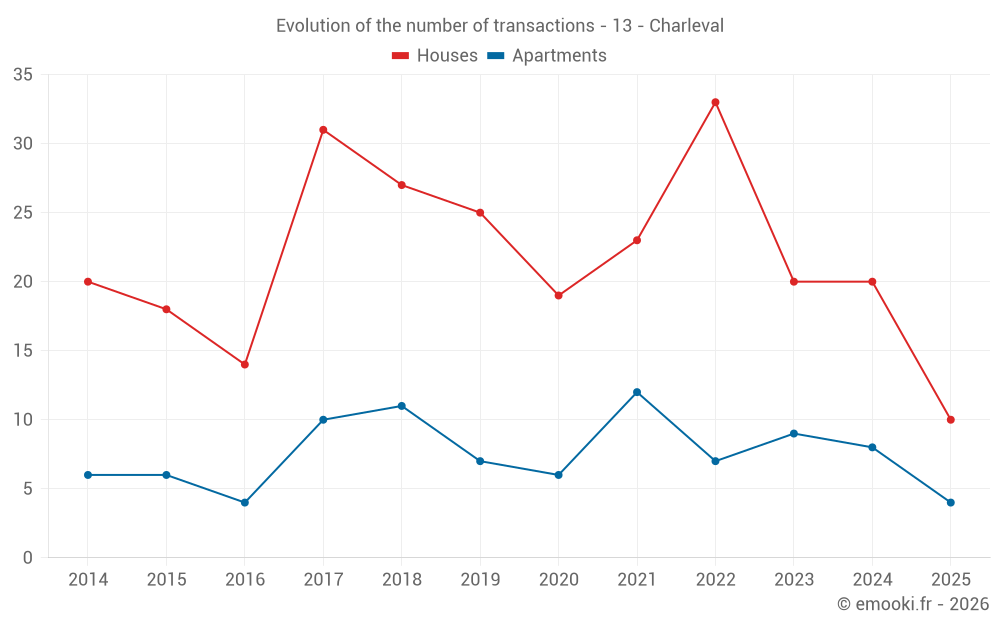
Median price on the 22 transactions of the last 12 months.
from 1 809 to
3 992  /m²
60% of transactions from the 2nd to the 8th deciles.
ApartmentsApartments
3 538  /m²
1-23-45-67-89-10
Reliability 7/10
Median price on the 17 transactions of the last 24 months.
from 2 886 to
4 038  /m²
60% of transactions from the 2nd to the 8th deciles.
DwellingsDwellings
3 378  /m²
1-23-45-67-89-10
Reliability 8/10
Median price on the 30 transactions of the last 12 months.
from 1 834 to
4 038  /m²
60% of transactions from the 2nd to the 8th deciles.
HousesEvolution of the price per m² of houses since...
1 year
-21%
2 years
-19%
3 years
-24%
4 years
-16%
5 years
-16%
6 years
-14%
7 years
-6.8%
8 years
-2.5%
9 years
+0%
10 years
+4.7%
11 years
+4.9%
The price per m² of houses has decreased by 24% since 3 years, but it has increased by 4.9% in 11 years.
ApartmentsEvolution of the price per m² of apartments since...
1 year
-3.7%
2 years
-3.3%
3 years
-0.2%
4 years
+13%
5 years
+77%
6 years
+106%
7 years
+32%
8 years
+18%
9 years
+32%
10 years
+101%
11 years
+119%
The price per m² of apartments has decreased by 3.7% since 1 year, but it has increased by 119% in 11 years.

Yearly evolution

Evolution of the median price per m²

Evolution of the median price per m² - 13 - Charleval

Evolution of the number of transactions

Warning, last year incomplete. Projections made based on the proportions between semesters of the previous year at the departmental/national level and by type of property.

Evolution of the number of transactions - 13 - Charleval

Yearly data

Descending order
Year
Houses
house
transactions
Houses
house
Price per m²
Apartments
apt.
transactions
Apartments
apt.
Price per m²
2025
10
2 517 
4
3 432 
2024
20
3 192 
8
3 564 
2023
20
3 117 
9
3 549 
2022
33
3 306 
7
3 440 
2021
23
2 994 
12
3 032 
2020
19
3 010 
6
1 940 
2019
25
2 921 
7
1 662 
2018
27
2 701 
11
2 605 
2017
31
2 582 
10
2 912 
2016
14
2 516 
4
2 606 
2015
18
2 404 
6
1 708 
2014
20
2 400 
6
1 570 

Analysis

Structure of prices per m²

Values of price percentiles per m² over the periods used for the estimated price of each type of property.

Structure of transaction amounts

Values of transaction amounts percentiles over the periods used for the estimated price of each type of property.

Transaction amounts and prices per m² by percentile

Ascending order
Percentile
Houses
house
Price per m²
Houses
house
Transaction amount
Apartments
apt.
Price per m²
Apartments
apt.
Transaction amount
10th percentile
1 592 
173 K
1 976 
136 K
20th percentile
1 809 
207 K
2 886 
192 K
30th percentile
2 155 
226 K
3 348 
227 K
40th percentile
2 433 
238 K
3 509 
268 K
50th percentile
2 756 
267 K
3 538 
285 K
60th percentile
3 409 
309 K
3 629 
298 K
70th percentile
3 679 
326 K
3 954 
311 K
80th percentile
3 992 
338 K
4 038 
319 K
90th percentile
4 268 
352 K
4 254 
339 K

National and departmental comparison

Evolution of the median price per m² of houses

Evolution of the median price per m² of apartments

Quarterly evolution

Evolution of the median price per m²

Evolution of the number of transactions

Quarterly data

Descending order
Quarter
Houses
house
transactions
Houses
house
Price per m²
Apartments
apt.
transactions
Apartments
apt.
Price per m²
2025 Q2
5
2 550 
2
2 306 
2025 Q1
5
1 843 
2
4 041 
2024 Q4
2
3 484 
4
3 519 
2024 Q3
10
2 901 
0
--- 
2024 Q2
3
2 542 
2
4 046 
2024 Q1
5
3 990 
2
4 659 
2023 Q4
5
2 922 
3
2 000 
2023 Q3
6
3 056 
2
3 532 
2023 Q2
3
3 000 
3
3 756 
2023 Q1
6
3 529 
1
3 549 
2022 Q4
6
2 137 
1
3 654 
2022 Q3
10
3 974 
1
3 440 
2022 Q2
10
3 859 
1
1 869 
2022 Q1
7
2 262 
4
2 938 
2021 Q4
4
2 814 
2
2 002 
2021 Q3
8
3 342 
2
3 370 
2021 Q2
3
2 994 
3
2 455 
2021 Q1
8
2 428 
5
3 333 
2020 Q4
6
2 552 
2
2 332 
2020 Q3
6
3 122 
1
2 069 
2020 Q2
2
3 009 
0
--- 
2020 Q1
5
3 647 
3
1 930 
2019 Q4
7
3 083 
5
1 580 
2019 Q3
6
3 028 
1
3 077 
2019 Q2
7
2 921 
0
--- 
2019 Q1
5
2 464 
1
2 371 
2018 Q4
7
2 714 
3
2 431 
2018 Q3
10
3 063 
4
2 477 
2018 Q2
3
2 197 
1
1 538 
2018 Q1
7
2 551 
3
3 176 
2017 Q4
7
2 828 
1
1 744 
2017 Q3
7
2 443 
6
2 912 
2017 Q2
9
2 663 
2
2 618 
2017 Q1
8
2 494 
1
3 510 
2016 Q4
3
2 749 
0
--- 
2016 Q3
4
2 616 
2
2 904 
2016 Q2
1
1 713 
2
2 606 
2016 Q1
6
2 516 
0
--- 
2015 Q4
5
3 000 
2
3 090 
2015 Q3
5
1 480 
2
1 590 
2015 Q2
3
4 880 
1
1 667 
2015 Q1
5
2 446 
1
1 400 
2014 Q4
3
2 417 
1
1 773 
2014 Q3
5
2 235 
0
--- 
2014 Q2
7
2 559 
2
1 448 
2014 Q1
5
2 963 
3
1 428 

Overview of the latest real estate transactions

The following list is an anonymized overview of the latest transactions. For more details and to find all transactions, please use the map to view transactions by plot or the transaction search page for a search by criteria.

2025-06-17
999 
Sale
Land
33 m2
-Sols
2025-06-17
7 260 
Sale
Land
242 m2
-Sols
2025-06-04
50 000 
1 786  /m²(28 m²)
Sale
Apartments
Apartment
1 room
28 m2
2025-06-03
3 300 
Sale
Land
4219 m2
-Terres
2025-06-02
20 000 
Sale
Land
3230 m2
-Terres
Land
3217 m2
-Terres
2025-05-15
122 000 
Sale
Land
324 m2
-Terrains à bâtir
2025-05-09
139 000 
Sale
Land
337 m2
-Terrains à bâtir
2025-04-28
330 000 
4 459  /m²(74 m²)
Sale
Houses
House
4 rooms
74 m2
Land
524 m2
-Sols
2025-04-18
5 000 
Sale
Land
1603 m2
-Jardins
/Jardin potager
2025-04-15
206 300 
2 399  /m²(86 m²)
Sale
Houses
House
3 rooms
86 m2
Land
86 m2
-Sols
2025-04-15
248 400 
2 484  /m²(100 m²)
Sale
Houses
House
4 rooms
100 m2
Land
70 m2
-Sols
2025-04-15
326 700 
3 936  /m²(83 m²)
Sale
Houses
House
4 rooms
83 m2
2 outbuildings
Land
667 m2
-Sols
Land
84 m2
-Terres
Land
37 m2
-Terres
Land
96 m2
-Terres
Land
142 m2
-Terres
Land
7 m2
-Terres
Land
28 m2
-Terres
2025-04-09
229 520 
2 550  /m²(90 m²)
Sale
Houses
House
4 rooms
90 m2
Land
75 m2
-Sols
2025-04-04
203 000 
Sale
1 outbuilding
Land
178 m2
-Sols
2025-04-02
226 000 
2 825  /m²(80 m²)
Sale
Apartments
Apartment
3 rooms
80 m2
3 outbuildings
Land
218 m2
-Sols
2025-03-21
262 500 
4 038  /m²(65 m²)
Sale
Apartments
Apartment
3 rooms
65 m2
1 outbuilding
2025-03-17
172 540 
1 569  /m²(110 m²)
Sale
Houses
House
5 rooms
110 m2
Land
58 m2
-Sols
2025-03-12
368 000 
4 044  /m²(91 m²)
Sale
Apartments
Apartment
3 rooms
91 m2
2 outbuildings
2025-03-06
230 400 
1 843  /m²(125 m²)
Sale
Houses
House
5 rooms
125 m2
Land
86 m2
-Sols
2025-03-04
100 
Sale
Land
488 m2
-Vergers
Land
155 m2
-Vergers
604 transactions listed in the municipality

Bouches-du-Rhône (13)

Most expensive cities

City
name
Descending orderHouses
house
Price per m²
9 500 
8 239 
7 336 
6 791 
City
name
Descending orderApartments
apt.
Price per m²
7 274 
7 009 
5 908 
5 274 
5 022 
4 950 

Least expensive cities

City
name
Ascending orderHouses
house
Price per m²
2 212 
2 338 
2 513 
2 574 
2 692 
2 756 
2 786 
2 865 
City
name
Ascending orderApartments
apt.
Price per m²
1 500 
1 655 
1 730 
1 806 
1 838