emooki
HomePrice mapTransactions
🇬🇧 English🇫🇷 Français🇩🇪 Deutsch🇪🇸 Español🇮🇹 Italiano

Real estate price map


Real estate price map in the municipality of Saint-Pierre-de-Mézoargues, choose a section to see transactions by parcel.

Bouches-du-Rhône (13)
Saint-Pierre-de-Mézoargues

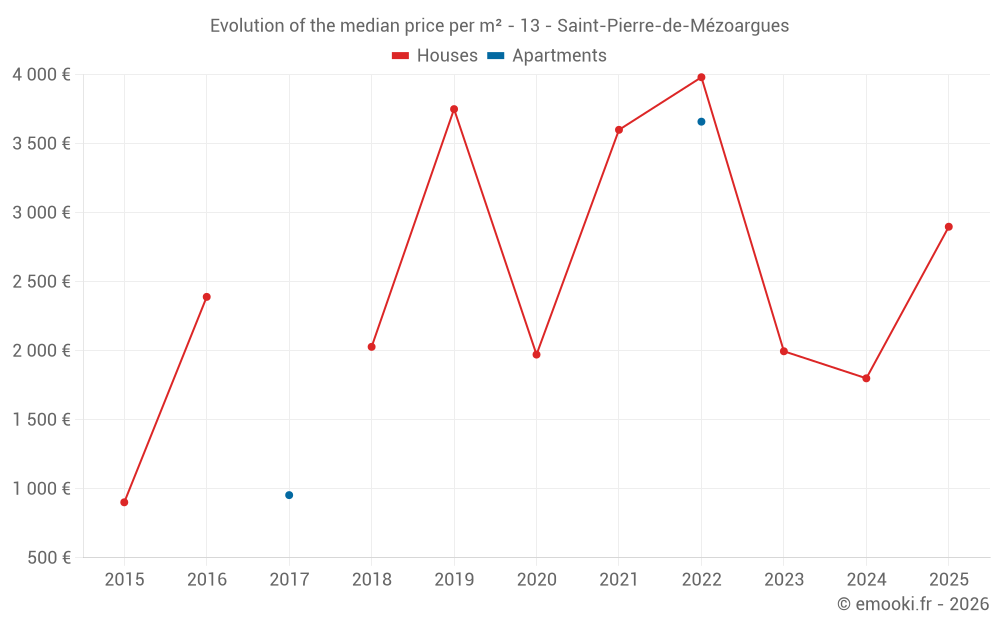
Median price of real estate
in the municipality of Saint-Pierre-de-Mézoargues

HousesHouses
3 030  /m²
1-23-45-67-89-10
Reliability 4/10
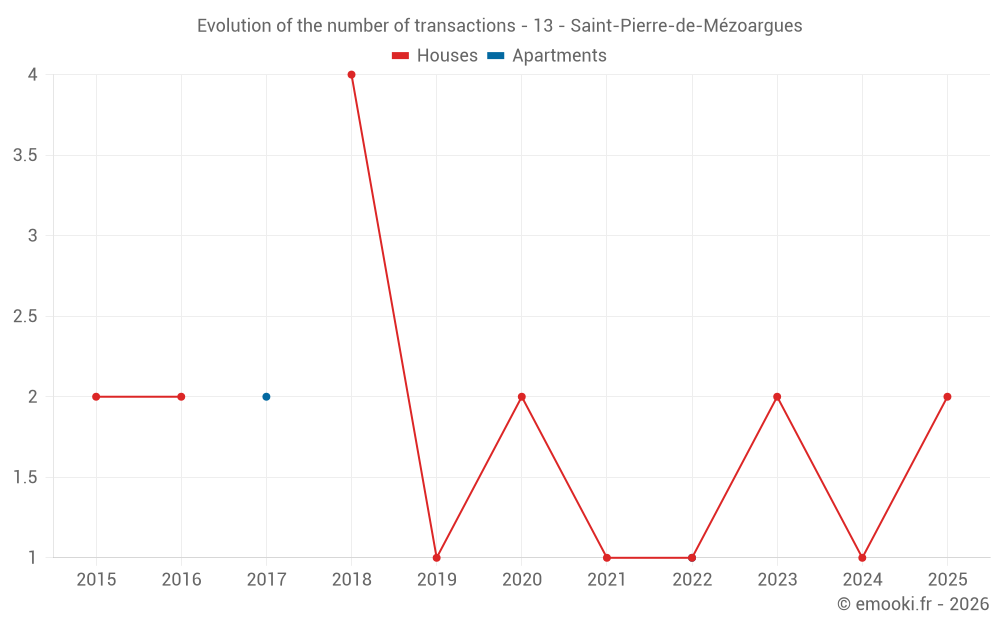
Median price on the 8 transactions of the last 60 months.
ApartmentsApartments
1 079  /m²
1-23-45-67-89-10
Reliability 1/10
Median price on the 3 transactions of the last 120 months.
DwellingsDwellings
3 182  /m²
1-23-45-67-89-10
Reliability 4/10
Median price on the 9 transactions of the last 60 months.

Yearly evolution

Evolution of the median price per m²

Evolution of the number of transactions

Warning, last year incomplete. Projections made based on the proportions between semesters of the previous year at the departmental/national level and by type of property.

Yearly data

Descending order
Year
Houses
house
transactions
Houses
house
Price per m²
Apartments
apt.
transactions
Apartments
apt.
Price per m²
2025
2
2 898 
0
--- 
2024
1
1 800 
0
--- 
2023
2
1 996 
0
--- 
2022
1
3 981 
1
3 659 
2021
1
3 600 
0
--- 
2020
2
1 972 
0
--- 
2019
1
3 750 
0
--- 
2018
4
2 028 
0
--- 
2017
0
--- 
2
954 
2016
2
2 390 
0
--- 
2015
2
902 
0
--- 
2014
0
--- 
0
--- 

Analysis

Structure of prices per m²

Values of price percentiles per m² over the periods used for the estimated price of each type of property.

Structure of transaction amounts

Values of transaction amounts percentiles over the periods used for the estimated price of each type of property.

Transaction amounts and prices per m² by percentile

Ascending order
Percentile
Houses
house
Price per m²
Houses
house
Transaction amount
Apartments
apt.
Price per m²
Apartments
apt.
Transaction amount
10th percentile
1 594 
136 K
878 
126 K
20th percentile
2 058 
177 K
928 
132 K
30th percentile
2 487 
225 K
979 
138 K
40th percentile
2 791 
260 K
1 029 
144 K
50th percentile
3 030 
275 K
1 079 
150 K
60th percentile
3 216 
279 K
1 595 
150 K
70th percentile
3 334 
280 K
2 111 
150 K
80th percentile
3 500 
301 K
2 627 
150 K
90th percentile
3 714 
406 K
3 143 
150 K

National and departmental comparison

Evolution of the median price per m² of houses

Evolution of the median price per m² of apartments

Quarterly evolution

Evolution of the median price per m²

Evolution of the number of transactions

Quarterly data

Descending order
Quarter
Houses
house
transactions
Houses
house
Price per m²
Apartments
apt.
transactions
Apartments
apt.
Price per m²
2025 Q2
1
3 351 
0
--- 
2025 Q1
1
2 444 
0
--- 
2024 Q4
1
1 800 
0
--- 
2023 Q4
1
2 878 
0
--- 
2023 Q3
1
1 113 
0
--- 
2022 Q3
0
--- 
1
3 659 
2022 Q2
1
3 981 
0
--- 
2021 Q2
1
3 600 
0
--- 
2020 Q3
1
3 182 
0
--- 
2020 Q2
1
763 
0
--- 
2019 Q3
1
3 750 
0
--- 
2018 Q3
2
2 028 
0
--- 
2018 Q2
1
3 811 
0
--- 
2018 Q1
1
1 379 
0
--- 
2017 Q2
0
--- 
1
1 079 
2017 Q1
0
--- 
1
828 
2016 Q2
1
2 782 
0
--- 
2016 Q1
1
1 998 
0
--- 
2015 Q2
2
902 
0
--- 

Overview of the latest real estate transactions

The following list is an anonymized overview of the latest transactions. For more details and to find all transactions, please use the map to view transactions by plot or the transaction search page for a search by criteria.

2025-06-23
278 000 
Sale
Land
467 m2
-Vergers
Land
402 m2
-Vergers
Land
540 m2
-Vergers
Land
541 m2
-Vergers
Land
10 m2
-Sols
Land
3 m2
-Sols
2025-06-06
315 000 
3 351  /m²(94 m²)
Sale
Houses
House
4 rooms
94 m2
Land
1790 m2
-Sols
2025-02-06
220 000 
2 444  /m²(90 m²)
Sale
Houses
House
4 rooms
90 m2
Land
287 m2
-Terres
Land
663 m2
-Sols
Land
1663 m2
-Terres
2024-12-06
270 000 
1 800  /m²(150 m²)
Sale
Houses
House
3 rooms
150 m2
Land
866 m2
-Sols
Land
3465 m2
-Terres
2024-09-03
7 000 
Sale
Land
3130 m2
-Vergers
Land
3355 m2
-Terres
2024-01-05
9 587 
Sale
Land
1151 m2
-Vergers
Land
2687 m2
-Vignes
Land
2553 m2
-Vignes
2023-10-26
279 185 
2 878  /m²(97 m²)
Sale
Houses
House
4 rooms
97 m2
Land
1328 m2
-Sols
2023-08-17
148 000 
1 113  /m²(133 m²)
Sale
Houses
House
2 rooms
50 m2
Houses
House
4 rooms
83 m2
1 outbuilding
Land
598 m2
-Sols
2023-05-10
3 500 
Sale
Land
3080 m2
-Vergers
2022-12-06
36 
Sale
Land
36 m2
-Sols
2022-11-29
5 000 
Sale
Land
131 m2
-Vergers
Land
684 m2
-Vergers
2022-09-19
150 000 
3 659  /m²(41 m²)
Sale
Apartments
Apartment
2 rooms
41 m2
2022-05-04
617 000 
3 981  /m²(155 m²)
Sale
Houses
House
6 rooms
155 m2
2 outbuildings
Land
424 m2
-Sols
Land
480 m2
-Terres
Land
316 m2
-Vignes
Land
500 m2
-Terres
2022-04-13
45 920 
Sale
Land
25511 m2
-Vergers
2021-12-01
120 000 
Sale
Land
881 m2
-Terrains à bâtir
2021-10-22
19 451 
Sale
Land
10806 m2
-Vergers
2021-06-09
108 000 
3 600  /m²(30 m²)
Sale
Houses
House
2 rooms
30 m2
Land
94 m2
-Sols
2021-02-09
80 000 
Sale
Land
3338 m2
-Vergers
Land
1440 m2
-Vergers
Land
2540 m2
-Vignes
Land
1330 m2
-Vergers
Land
2940 m2
-Vergers
Land
871 m2
-Vignes
Land
2380 m2
-Vergers
Land
580 m2
-Vignes
Land
4390 m2
-Vergers
Land
315 m2
-Landes
Land
1370 m2
-Landes
Land
365 m2
-Landes
Land
176 m2
-Landes
Land
315 m2
-Landes
Land
950 m2
-Vergers
Land
7515 m2
-Vergers
Land
410 m2
-Vignes
Land
1060 m2
-Vignes
Land
1630 m2
-Vergers
Land
1630 m2
-Vergers
Land
1525 m2
-Vergers
Land
2730 m2
-Vergers
Land
860 m2
-Vergers
Land
441 m2
-Vergers
Land
4291 m2
-Vergers
Land
1195 m2
-Vergers
Land
4185 m2
-Vergers
Land
1072 m2
-Vergers
Land
1509 m2
-Vergers
Land
1488 m2
-Vergers
Land
1557 m2
-Vignes
Land
6831 m2
-Vergers
Land
3090 m2
-Vignes
Land
1214 m2
-Vergers
2021-02-05
2 939 
Sale
Land
2449 m2
-Vergers
2020-10-14
3 442 
Sale
Land
2151 m2
-Vergers

Bouches-du-Rhône (13)

Most expensive cities

City
name
Descending orderHouses
house
Price per m²
9 500 
8 239 
7 336 
6 791 
City
name
Descending orderApartments
apt.
Price per m²
7 274 
7 009 
5 908 
5 274 
5 022 
4 950 

Least expensive cities

City
name
Ascending orderHouses
house
Price per m²
2 212 
2 338 
2 513 
2 574 
2 692 
2 756 
2 786 
2 865 
City
name
Ascending orderApartments
apt.
Price per m²
1 500 
1 655 
1 730 
1 806 
1 838