Median price of real estate
in the municipality of Eygalières
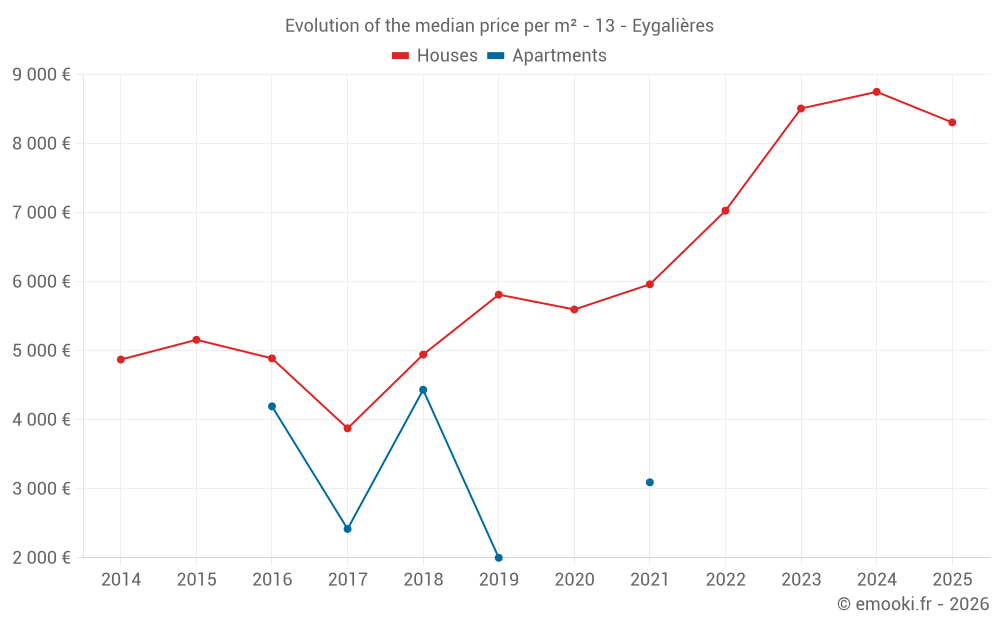
Houses
8 239 € /m²
Reliability 8/10
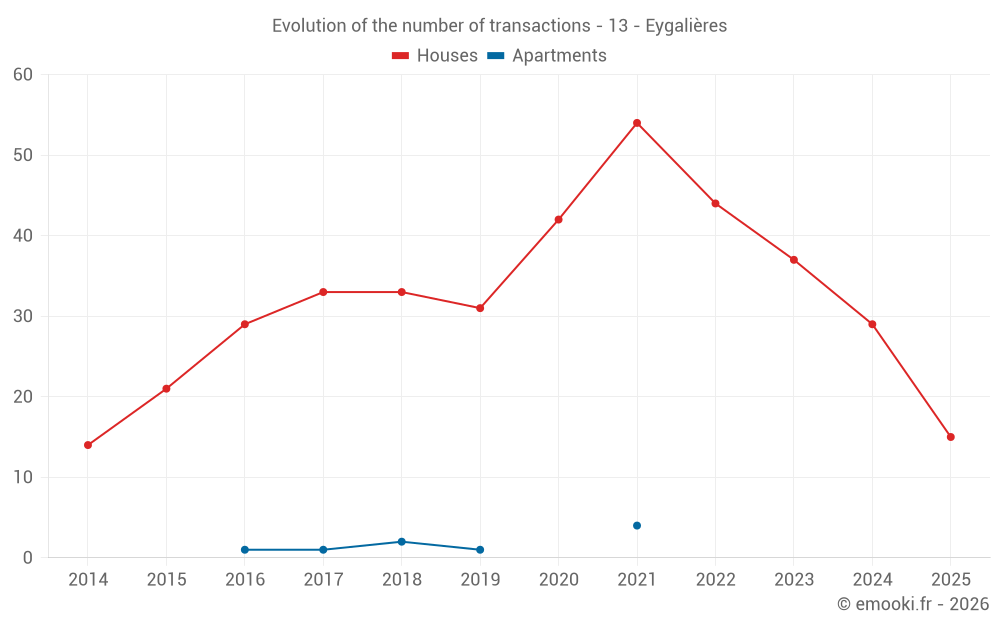
Median price on the 30 transactions of the last 12 months.
from 4 554 to
11 783 € /m²
11 783 € /m²
60% of transactions from the 2nd to the 8th deciles.
Apartments
3 093 € /m²
Reliability 2/10
Median price on the 8 transactions of the last 96 months.
Dwellings
8 239 € /m²
Reliability 8/10
Median price on the 30 transactions of the last 12 months.
from 4 554 to
11 783 € /m²
11 783 € /m²
60% of transactions from the 2nd to the 8th deciles.