Median price of real estate
in the municipality of Marseille 14e Arrondissement
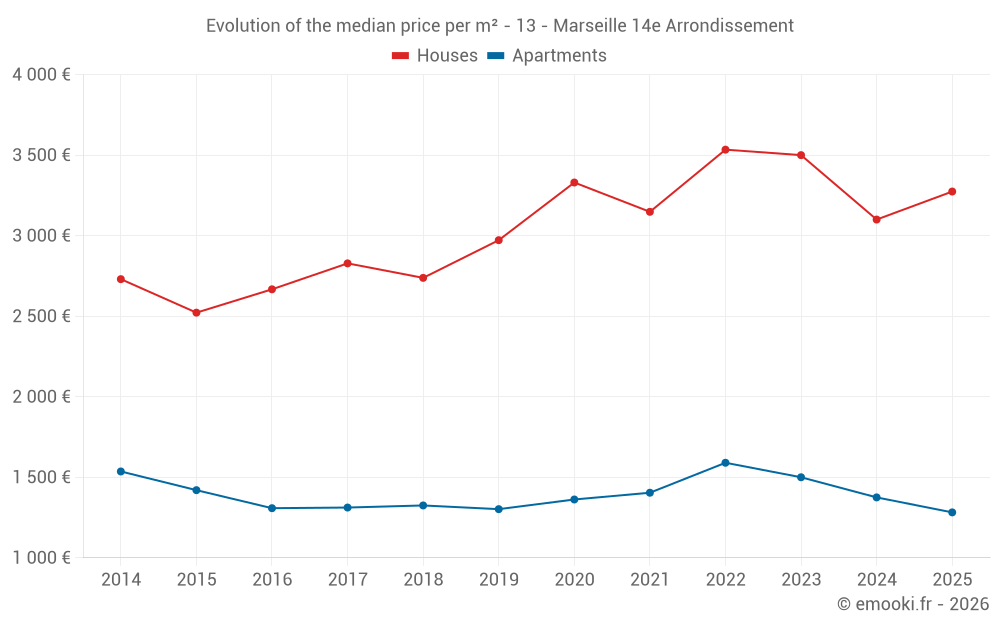
Houses
3 274 € /m²
Reliability 9/10
Median price on the 31 transactions of the last 6 months.
from 2 167 to
4 444 € /m²
4 444 € /m²
60% of transactions from the 2nd to the 8th deciles.
Apartments
1 248 € /m²
Reliability 10/10
Median price on the 80 transactions of the last 3 months.
from 702 to
1 865 € /m²
1 865 € /m²
60% of transactions from the 2nd to the 8th deciles.
Dwellings
1 353 € /m²
Reliability 10/10
Median price on the 94 transactions of the last 3 months.
from 812 to
2 443 € /m²
2 443 € /m²
60% of transactions from the 2nd to the 8th deciles.