emooki
HomePrice mapTransactions
🇬🇧 English🇫🇷 Français🇩🇪 Deutsch🇪🇸 Español🇮🇹 Italiano

Real estate price map


Real estate price map in the municipality of Ensuès-la-Redonne, choose a section to see transactions by parcel.

Bouches-du-Rhône (13)
Ensuès-la-Redonne

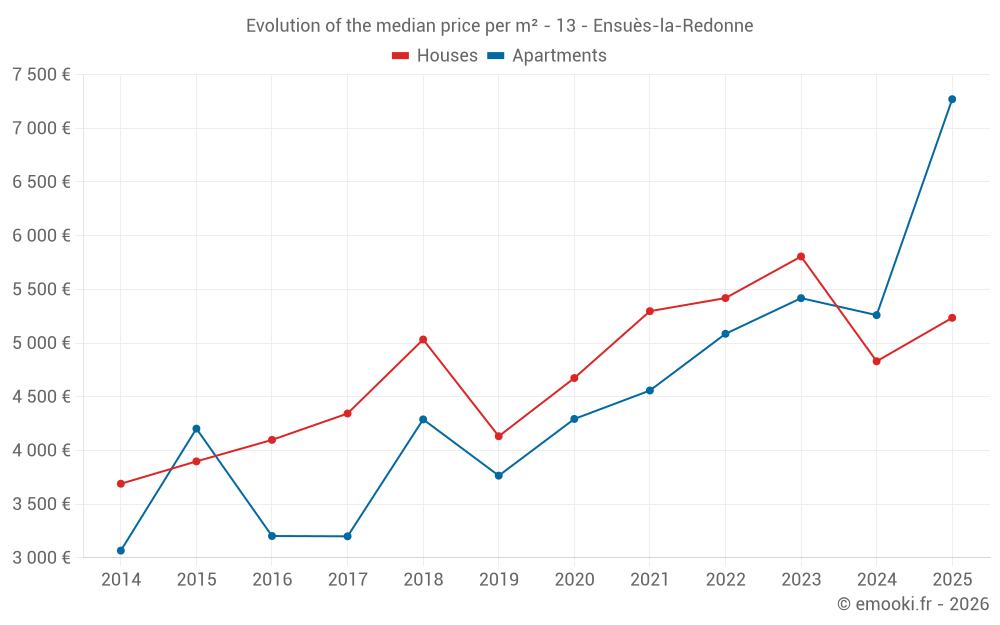
Median price of real estate
in the municipality of Ensuès-la-Redonne

HousesHouses
5 235  /m²
1-23-45-67-89-10
Reliability 8/10
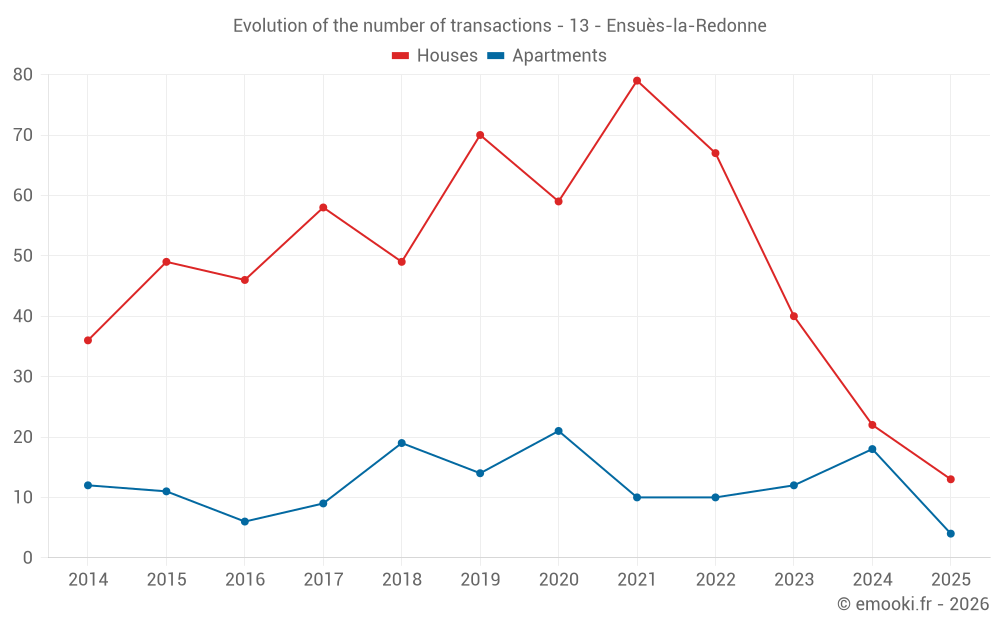
Median price on the 27 transactions of the last 12 months.
from 4 431 to
6 164  /m²
60% of transactions from the 2nd to the 8th deciles.
ApartmentsApartments
5 427  /m²
1-23-45-67-89-10
Reliability 8/10
Median price on the 18 transactions of the last 12 months.
from 4 118 to
6 655  /m²
60% of transactions from the 2nd to the 8th deciles.
DwellingsDwellings
5 235  /m²
1-23-45-67-89-10
Reliability 8/10
Median price on the 45 transactions of the last 12 months.
from 4 341 to
6 549  /m²
60% of transactions from the 2nd to the 8th deciles.
HousesEvolution of the price per m² of houses since...
1 year
+8.4%
2 years
-10%
3 years
-3.4%
4 years
-1.2%
5 years
+12%
6 years
+27%
7 years
+4%
8 years
+21%
9 years
+28%
10 years
+34%
11 years
+42%
The price per m² of houses has decreased by 10% since 2 years, but it has increased by 42% in 11 years.
ApartmentsEvolution of the price per m² of apartments since...
1 year
+38%
2 years
+34%
3 years
+43%
4 years
+60%
5 years
+69%
6 years
+93%
7 years
+70%
8 years
+127%
9 years
+127%
10 years
+73%
11 years
+137%

Yearly evolution

Evolution of the median price per m²

Evolution of the number of transactions

Warning, last year incomplete. Projections made based on the proportions between semesters of the previous year at the departmental/national level and by type of property.

Yearly data

Descending order
Year
Houses
house
transactions
Houses
house
Price per m²
Apartments
apt.
transactions
Apartments
apt.
Price per m²
2025
13
5 235 
4
7 271 
2024
22
4 830 
18
5 260 
2023
40
5 806 
12
5 418 
2022
67
5 419 
10
5 086 
2021
79
5 297 
10
4 558 
2020
59
4 674 
21
4 293 
2019
70
4 132 
14
3 765 
2018
49
5 033 
19
4 289 
2017
58
4 344 
9
3 200 
2016
46
4 098 
6
3 203 
2015
49
3 898 
11
4 203 
2014
36
3 690 
12
3 067 

Analysis

Structure of prices per m²

Values of price percentiles per m² over the periods used for the estimated price of each type of property.

Structure of transaction amounts

Values of transaction amounts percentiles over the periods used for the estimated price of each type of property.

Transaction amounts and prices per m² by percentile

Ascending order
Percentile
Houses
house
Price per m²
Houses
house
Transaction amount
Apartments
apt.
Price per m²
Apartments
apt.
Transaction amount
10th percentile
3 885 
297 K
3 354 
149 K
20th percentile
4 431 
410 K
4 118 
190 K
30th percentile
4 606 
444 K
4 460 
229 K
40th percentile
4 851 
469 K
5 009 
236 K
50th percentile
5 235 
515 K
5 427 
243 K
60th percentile
5 533 
539 K
6 120 
252 K
70th percentile
5 771 
567 K
6 341 
299 K
80th percentile
6 164 
644 K
6 655 
329 K
90th percentile
8 133 
773 K
7 220 
746 K

National and departmental comparison

Evolution of the median price per m² of houses

Evolution of the median price per m² of apartments

Quarterly evolution

Evolution of the median price per m²

Evolution of the number of transactions

Quarterly data

Descending order
Quarter
Houses
house
transactions
Houses
house
Price per m²
Apartments
apt.
transactions
Apartments
apt.
Price per m²
2025 Q2
4
8 429 
1
4 347 
2025 Q1
9
4 968 
3
7 399 
2024 Q4
10
5 124 
8
5 149 
2024 Q3
4
5 436 
6
5 334 
2024 Q2
2
5 682 
1
5 904 
2024 Q1
6
3 772 
3
5 367 
2023 Q4
8
6 111 
0
--- 
2023 Q3
16
5 296 
3
5 157 
2023 Q2
10
6 517 
5
4 789 
2023 Q1
6
5 304 
4
5 810 
2022 Q4
16
5 035 
4
6 041 
2022 Q3
21
5 650 
3
5 458 
2022 Q2
17
5 187 
3
3 288 
2022 Q1
13
6 349 
0
--- 
2021 Q4
16
5 552 
2
4 839 
2021 Q3
33
5 098 
3
4 571 
2021 Q2
16
5 698 
2
5 020 
2021 Q1
14
4 060 
3
3 448 
2020 Q4
21
4 563 
7
3 652 
2020 Q3
17
4 500 
3
4 474 
2020 Q2
11
5 122 
4
4 048 
2020 Q1
10
4 444 
7
4 293 
2019 Q4
15
4 167 
6
4 016 
2019 Q3
19
3 878 
2
4 496 
2019 Q2
18
4 289 
2
3 912 
2019 Q1
18
5 022 
4
3 530 
2018 Q4
16
5 616 
4
5 027 
2018 Q3
12
4 367 
4
4 216 
2018 Q2
13
5 000 
5
3 978 
2018 Q1
8
4 679 
6
4 560 
2017 Q4
14
4 200 
1
3 182 
2017 Q3
15
4 164 
4
3 319 
2017 Q2
13
4 371 
1
3 200 
2017 Q1
16
4 442 
3
4 254 
2016 Q4
8
4 268 
1
3 333 
2016 Q3
14
3 980 
2
3 266 
2016 Q2
11
3 366 
1
2 456 
2016 Q1
13
4 414 
2
3 203 
2015 Q4
21
4 046 
2
3 742 
2015 Q3
11
4 110 
3
5 985 
2015 Q2
9
4 077 
4
3 414 
2015 Q1
8
3 392 
2
3 406 
2014 Q4
9
3 500 
5
3 098 
2014 Q3
12
3 876 
3
4 250 
2014 Q2
7
3 958 
2
2 660 
2014 Q1
8
2 594 
2
3 067 

Overview of the latest real estate transactions

The following list is an anonymized overview of the latest transactions. For more details and to find all transactions, please use the map to view transactions by plot or the transaction search page for a search by criteria.

2025-06-26
2 300 
Sale
Land
7688 m2
-Landes
/Pâture plantée
2025-06-26
738 670 
12 311  /m²(60 m²)
Sale
Houses
House
3 rooms
60 m2
Land
170 m2
-Sols
2025-06-17
685 000 
5 708  /m²(120 m²)
Sale
Houses
House
5 rooms
120 m2
1 outbuilding
Land
988 m2
-Sols
2025-05-27
260 800 
4 347  /m²(60 m²)
Sale
Apartments
Apartment
3 rooms
60 m2
2 outbuildings
2025-05-19
45 000 
Sale
2025-04-29
1 115 020 
11 150  /m²(100 m²)
Sale
Houses
House
4 rooms
100 m2
Land
486 m2
-Sols
2025-04-24
825 000 
4 319  /m²(191 m²)
Sale
Houses
House
6 rooms
191 m2
1 outbuilding
Land
1166 m2
-Sols
2025-04-15
390 000 
Sale
Land
1438 m2
-Terrains à bâtir
2025-04-01
358 000 
Sale
Land
1156 m2
-Terrains à bâtir
Land
605 m2
-Terrains à bâtir
Land
194 m2
-Terrains à bâtir
2025-03-06
185 000 
4 868  /m²(38 m²)
Sale
Houses
House
3 rooms
38 m2
Land
41 m2
-Sols
2025-03-03
235 200 
7 587  /m²(31 m²)
Sale
Apartments
Apartment
1 room
31 m2
2 outbuildings
1 outbuilding
2025-02-27
445 000 
5 235  /m²(85 m²)
Sale
Houses
House
4 rooms
85 m2
Land
285 m2
-Sols
2025-02-27
603 700 
4 539  /m²(133 m²)
Sale
Houses
House
4 rooms
133 m2
Land
1153 m2
-Sols
Land
154 m2
-Landes
/Pâture plantée
2025-02-25
462 000 
4 968  /m²(93 m²)
Sale
Houses
House
4 rooms
93 m2
1 outbuilding
Land
987 m2
-Sols
Land
188 m2
-Landes
/Rocs ou rochers
2025-02-25
1 350 
Sale
Land
5 m2
-Landes
/Pâture plantée
2025-02-24
2 400 
Sale
Land
3790 m2
-Terres
Land
133 m2
-Landes
Land
1389 m2
-Landes
Land
2712 m2
-Landes
2025-01-31
150 000 
7 143  /m²(21 m²)
Sale
Apartments
Apartment
1 room
21 m2
1 outbuilding
2025-01-31
654 600 
6 891  /m²(95 m²)
Sale
Houses
House
4 rooms
95 m2
1 outbuilding
Land
597 m2
-Sols
2025-01-30
595 000 
4 612  /m²(129 m²)
Sale
Houses
House
4 rooms
129 m2
Land
944 m2
-Sols
2025-01-30
540 000 
5 243  /m²(103 m²)
Sale
Houses
House
4 rooms
103 m2
1 outbuilding
Land
1028 m2
-Sols

Bouches-du-Rhône (13)

Most expensive cities

City
name
Descending orderHouses
house
Price per m²
9 500 
8 239 
7 336 
6 791 
City
name
Descending orderApartments
apt.
Price per m²
7 274 
7 009 
5 908 
5 274 
5 022 
4 950 

Least expensive cities

City
name
Ascending orderHouses
house
Price per m²
2 212 
2 338 
2 513 
2 574 
2 692 
2 756 
2 786 
2 865 
City
name
Ascending orderApartments
apt.
Price per m²
1 500 
1 655 
1 730 
1 806 
1 838