emooki
HomePrice mapTransactions
🇬🇧 English🇫🇷 Français🇩🇪 Deutsch🇪🇸 Español🇮🇹 Italiano

Real estate price map


Real estate price map in the municipality of Cabannes, choose a section to see transactions by parcel.

Bouches-du-Rhône (13)
Cabannes

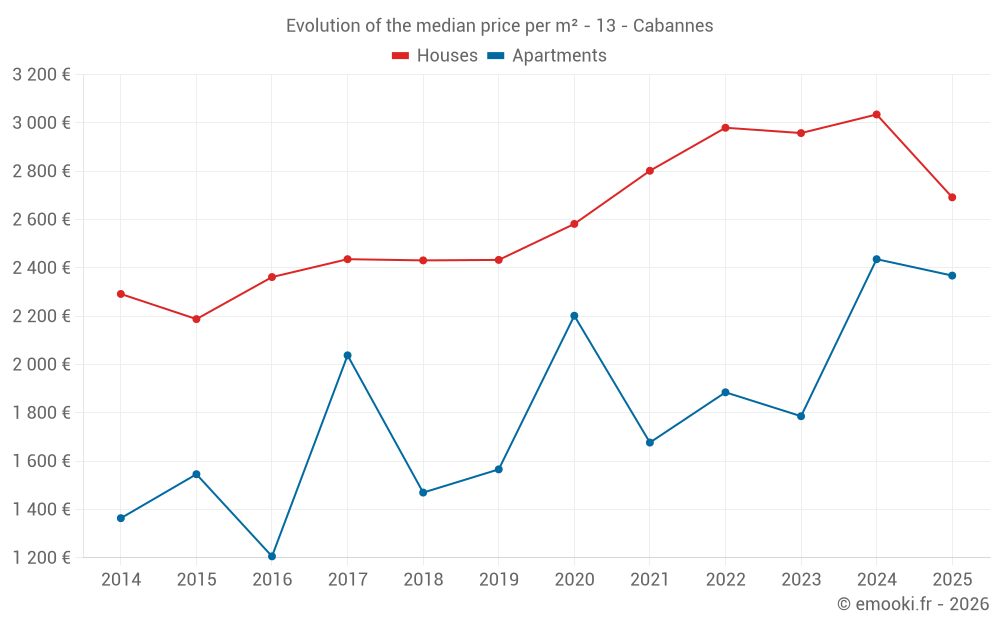
Median price of real estate
in the municipality of Cabannes

HousesHouses
2 692 € /m²
1-23-45-67-89-10
Reliability 9/10
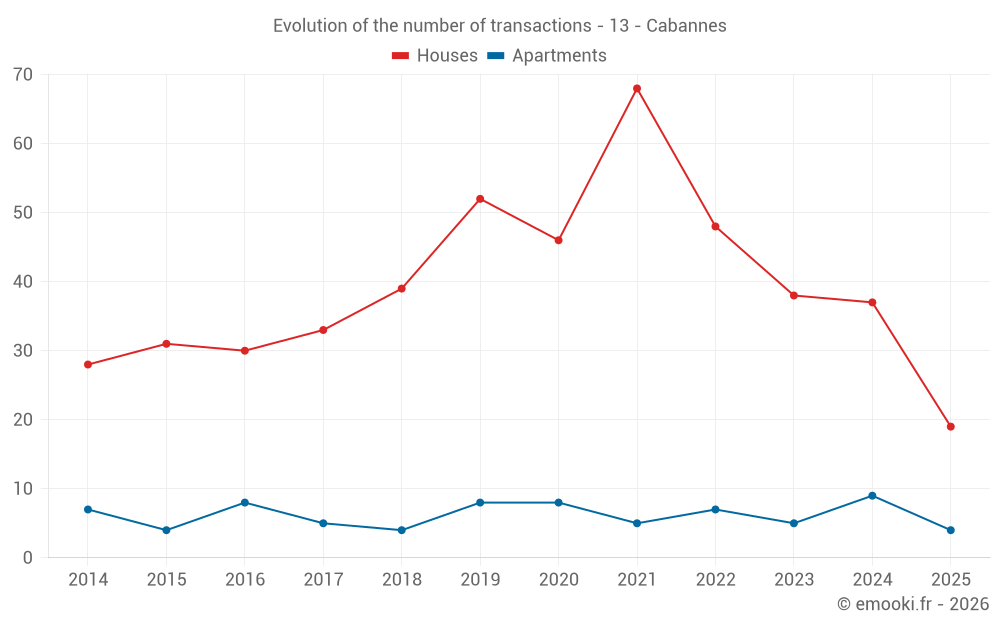
Median price on the 19 transactions of the last 6 months.
from 2 210 to
2 993 € /m²
60% of transactions from the 2nd to the 8th deciles.
ApartmentsApartments
2 406 € /m²
1-23-45-67-89-10
Reliability 7/10
Median price on the 16 transactions of the last 24 months.
from 1 314 to
2 735 € /m²
60% of transactions from the 2nd to the 8th deciles.
DwellingsDwellings
2 692 € /m²
1-23-45-67-89-10
Reliability 9/10
Median price on the 23 transactions of the last 6 months.
from 1 916 to
3 011 € /m²
60% of transactions from the 2nd to the 8th deciles.
HousesEvolution of the price per m² of houses since...
1 year
-11%
2 years
-9%
3 years
-10%
4 years
-3.9%
5 years
+4.3%
6 years
+11%
7 years
+11%
8 years
+11%
9 years
+14%
10 years
+23%
11 years
+17%
The price per m² of houses has decreased by 11% since 1 year, but it has increased by 23% in 10 years.
ApartmentsEvolution of the price per m² of apartments since...
1 year
-2.8%
2 years
+33%
3 years
+26%
4 years
+41%
5 years
+7.5%
6 years
+51%
7 years
+61%
8 years
+16%
9 years
+96%
10 years
+53%
11 years
+74%
The price per m² of apartments has decreased by 2.8% since 1 year, but it has increased by 96% in 9 years.

Yearly evolution

Evolution of the median price per m²

Evolution of the number of transactions

Warning, last year incomplete. Projections made based on the proportions between semesters of the previous year at the departmental/national level and by type of property.

Yearly data

Descending order
Year
Houses
house
transactions
Houses
house
Price per m²
Apartments
apt.
transactions
Apartments
apt.
Price per m²
2025
19
2 692 €
4
2 368 €
2024
37
3 035 €
9
2 436 €
2023
38
2 958 €
5
1 786 €
2022
48
2 980 €
7
1 885 €
2021
68
2 802 €
5
1 677 €
2020
46
2 582 €
8
2 202 €
2019
52
2 433 €
8
1 566 €
2018
39
2 431 €
4
1 470 €
2017
33
2 436 €
5
2 038 €
2016
30
2 362 €
8
1 206 €
2015
31
2 188 €
4
1 546 €
2014
28
2 292 €
7
1 364 €

Analysis

Structure of prices per m²

Values of price percentiles per m² over the periods used for the estimated price of each type of property.

Structure of transaction amounts

Values of transaction amounts percentiles over the periods used for the estimated price of each type of property.

Transaction amounts and prices per m² by percentile

Ascending order
Percentile
Houses
house
Price per m²
Houses
house
Transaction amount
Apartments
apt.
Price per m²
Apartments
apt.
Transaction amount
10th percentile
1 752 €
151 K€
1 068 €
82 500 €
20th percentile
2 210 €
193 K€
1 314 €
115 K€
30th percentile
2 530 €
219 K€
1 751 €
146 K€
40th percentile
2 636 €
242 K€
1 894 €
155 K€
50th percentile
2 692 €
257 K€
2 406 €
160 K€
60th percentile
2 838 €
260 K€
2 436 €
194 K€
70th percentile
2 879 €
293 K€
2 710 €
215 K€
80th percentile
2 993 €
329 K€
2 735 €
268 K€
90th percentile
3 310 €
360 K€
3 054 €
324 K€

National and departmental comparison

Evolution of the median price per m² of houses

Evolution of the median price per m² of apartments

Quarterly evolution

Evolution of the median price per m²

Evolution of the number of transactions

Quarterly data

Descending order
Quarter
Houses
house
transactions
Houses
house
Price per m²
Apartments
apt.
transactions
Apartments
apt.
Price per m²
2025 Q2
9
2 809 €
2
1 894 €
2025 Q1
10
2 672 €
2
2 368 €
2024 Q4
17
2 628 €
1
2 692 €
2024 Q3
9
3 267 €
3
2 394 €
2024 Q2
5
1 872 €
3
2 417 €
2024 Q1
6
2 726 €
2
2 586 €
2023 Q4
9
3 333 €
3
1 786 €
2023 Q3
7
3 522 €
0
--- €
2023 Q2
9
2 538 €
2
2 444 €
2023 Q1
13
2 960 €
0
--- €
2022 Q4
12
2 266 €
0
--- €
2022 Q3
8
3 621 €
0
--- €
2022 Q2
9
2 733 €
5
1 885 €
2022 Q1
19
3 144 €
2
1 964 €
2021 Q4
16
2 093 €
3
1 931 €
2021 Q3
21
3 056 €
0
--- €
2021 Q2
21
2 667 €
2
1 553 €
2021 Q1
10
2 844 €
0
--- €
2020 Q4
13
2 222 €
2
2 460 €
2020 Q3
12
2 898 €
2
1 881 €
2020 Q2
12
2 692 €
3
2 313 €
2020 Q1
9
2 550 €
1
2 237 €
2019 Q4
10
2 494 €
2
2 154 €
2019 Q3
20
2 404 €
1
1 792 €
2019 Q2
14
2 345 €
3
1 250 €
2019 Q1
8
2 156 €
2
1 554 €
2018 Q4
9
2 516 €
1
1 283 €
2018 Q3
11
2 083 €
1
1 327 €
2018 Q2
10
2 679 €
1
1 765 €
2018 Q1
9
2 308 €
1
1 612 €
2017 Q4
12
2 365 €
1
2 303 €
2017 Q3
2
2 098 €
1
2 425 €
2017 Q2
9
2 604 €
1
1 897 €
2017 Q1
10
2 264 €
2
1 671 €
2016 Q4
5
2 656 €
1
1 181 €
2016 Q3
8
2 438 €
3
632 €
2016 Q2
13
2 320 €
3
1 395 €
2016 Q1
4
2 016 €
1
684 €
2015 Q4
12
2 135 €
2
1 298 €
2015 Q3
9
2 273 €
1
1 818 €
2015 Q2
7
1 800 €
0
--- €
2015 Q1
3
2 167 €
1
1 636 €
2014 Q4
12
2 352 €
2
1 688 €
2014 Q3
4
2 271 €
0
--- €
2014 Q2
5
2 317 €
3
1 422 €
2014 Q1
7
1 700 €
2
1 182 €

Overview of the latest real estate transactions

The following list is an anonymized overview of the latest transactions. For more details and to find all transactions, please use the map to view transactions by plot or the transaction search page for a search by criteria.

2025-06-16
925 000 €
5 168 € /m²(179 m²)
11 709 € /m²(79 m²)
Sale
1 outbuilding
Land
1210 m2
-Sols
Apartments
Apartment
2 rooms
79 m2
Commercial property
50 m2
Commercial property
50 m2
1 outbuilding
Land
1025 m2
-Sols
2025-06-05
63 000 €
700 € /m²(90 m²)
Sale
Apartments
Apartment
3 rooms
90 m2
2025-05-28
563 640 €
Sale
Land
4880 m2
-Sols
2025-05-26
1 174 000 €
3 089 € /m²(380 m²)
Sale
Apartments
Apartment
5 rooms
145 m2
Apartments
Apartment
6 rooms
150 m2
Apartments
Apartment
2 rooms
85 m2
2 outbuildings
Land
22242 m2
-Terres
Land
1000 m2
-Sols
2025-05-20
330 000 €
3 300 € /m²(100 m²)
Sale
Houses
House
4 rooms
100 m2
Land
406 m2
-Sols
2025-05-19
420 000 €
2 897 € /m²(145 m²)
Sale
Houses
House
5 rooms
145 m2
1 outbuilding
Land
729 m2
-Sols
Land
2725 m2
-Vergers
Land
1400 m2
-Vergers
Land
2290 m2
-Vergers
2025-05-15
4 000 €
Sale
Land
2660 m2
-Terres
2025-05-06
200 000 €
2 632 € /m²(76 m²)
Sale
Houses
House
3 rooms
76 m2
Land
430 m2
-Sols
2025-05-06
215 000 €
2 150 € /m²(100 m²)
Sale
Houses
House
3 rooms
100 m2
Land
93 m2
-Sols
2025-04-30
105 000 €
Sale
Land
532 m2
-Terres
2025-04-28
18 120 €
Sale
Land
5980 m2
-Vergers
Land
4305 m2
-Vergers
2025-04-23
276 000 €
2 845 € /m²(97 m²)
Sale
Houses
House
4 rooms
97 m2
Land
467 m2
-Sols
Land
16 m2
-Sols
Land
8433 m2
-Sols
Land
462 m2
-Sols
2025-04-18
183 000 €
1 760 € /m²(104 m²)
Sale
Houses
House
4 rooms
104 m2
Land
94 m2
-Sols
2025-04-14
345 000 €
3 350 € /m²(103 m²)
Sale
Houses
House
4 rooms
103 m2
2 outbuildings
Land
1070 m2
-Sols
Land
427 m2
-Sols
2025-04-10
260 000 €
2 574 € /m²(101 m²)
Sale
Houses
House
5 rooms
101 m2
Land
401 m2
-Sols
2025-04-08
2 050 €
Sale
Land
102 m2
-Sols
2025-04-04
250 000 €
2 809 € /m²(89 m²)
Sale
Houses
House
3 rooms
89 m2
Land
135 m2
-Sols
2025-03-27
305 000 €
2 652 € /m²(115 m²)
Sale
Houses
House
5 rooms
115 m2
Land
666 m2
-Sols
Land
192 m2
-Sols
2025-03-25
3 020 €
Sale
Land
4093 m2
-Vergers
2025-03-17
239 500 €
2 851 € /m²(84 m²)
Sale
Houses
House
5 rooms
84 m2
Land
636 m2
-Sols

Bouches-du-Rhône (13)

Most expensive cities

City
name
Descending orderHouses
house
Price per m²
10 279 €
9 500 €
8 239 €
8 071 €
7 531 €
7 481 €
7 377 €
7 336 €
6 857 €
6 791 €
City
name
Descending orderApartments
apt.
Price per m²
7 564 €
7 274 €
7 009 €
5 908 €
5 427 €
5 274 €
5 051 €
5 022 €
5 020 €
4 950 €

Least expensive cities

City
name
Ascending orderHouses
house
Price per m²
2 212 €
2 338 €
2 365 €
2 513 €
2 574 €
2 652 €
2 692 €
2 756 €
2 786 €
2 865 €
City
name
Ascending orderApartments
apt.
Price per m²
1 120 €
1 248 €
1 352 €
1 494 €
1 500 €
1 655 €
1 730 €
1 806 €
1 838 €