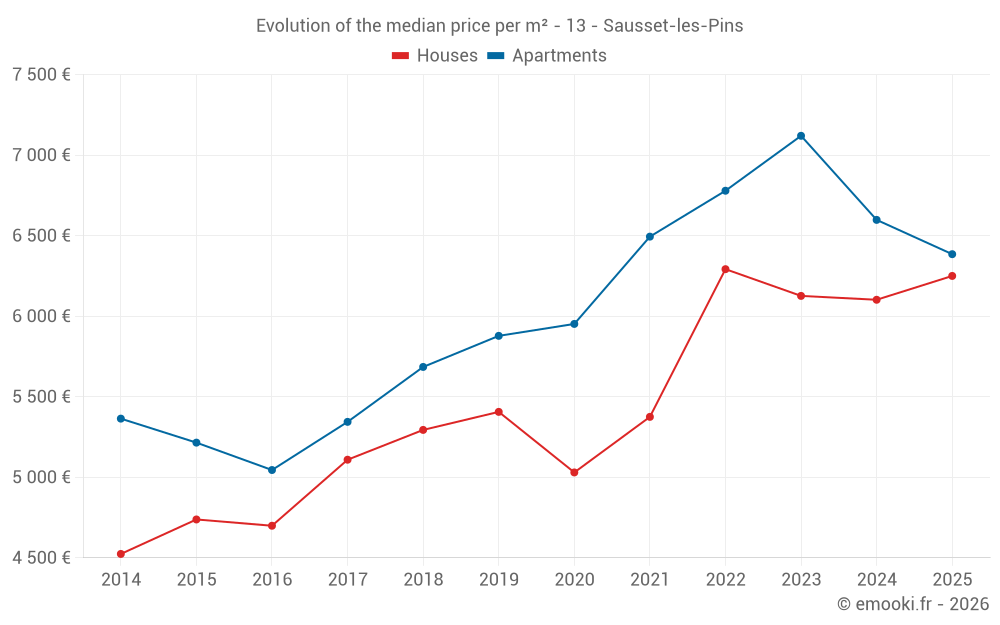
Median price of real estate
in the municipality of Sausset-les-Pins
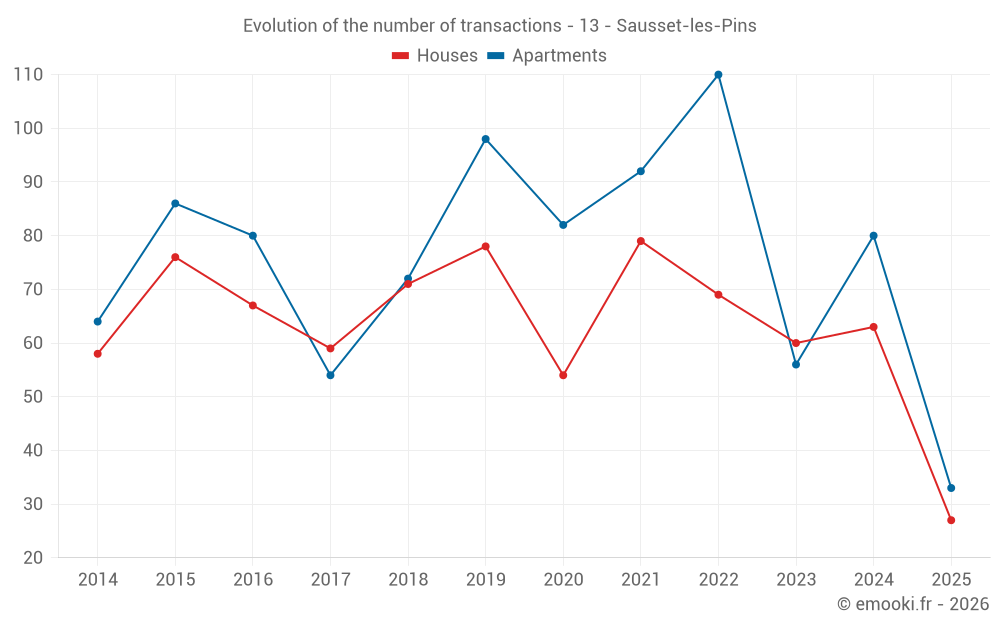
Houses
6 250 € /m²
Reliability 9/10
Median price on the 27 transactions of the last 6 months.
from 4 910 to
7 902 € /m²
7 902 € /m²
60% of transactions from the 2nd to the 8th deciles.
Apartments
7 009 € /m²
Reliability 10/10
Median price on the 23 transactions of the last 3 months.
from 5 074 to
8 789 € /m²
8 789 € /m²
60% of transactions from the 2nd to the 8th deciles.
Dwellings
6 697 € /m²
Reliability 10/10
Median price on the 36 transactions of the last 3 months.
from 5 072 to
8 553 € /m²
8 553 € /m²
60% of transactions from the 2nd to the 8th deciles.