emooki
HomePrice mapTransactions
🇬🇧 English🇫🇷 Français🇩🇪 Deutsch🇪🇸 Español🇮🇹 Italiano

Real estate price map


Real estate price map in the municipality of Cassis, choose a section to see transactions by parcel.

Bouches-du-Rhône (13)
Cassis

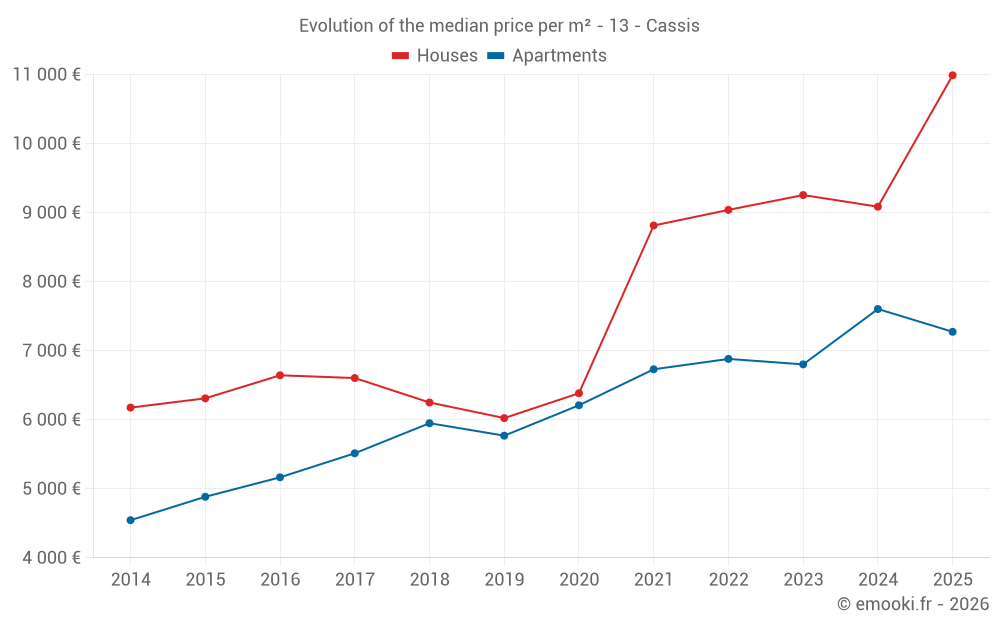
Median price of real estate
in the municipality of Cassis

HousesHouses
9 500 € /m²
1-23-45-67-89-10
Reliability 8/10
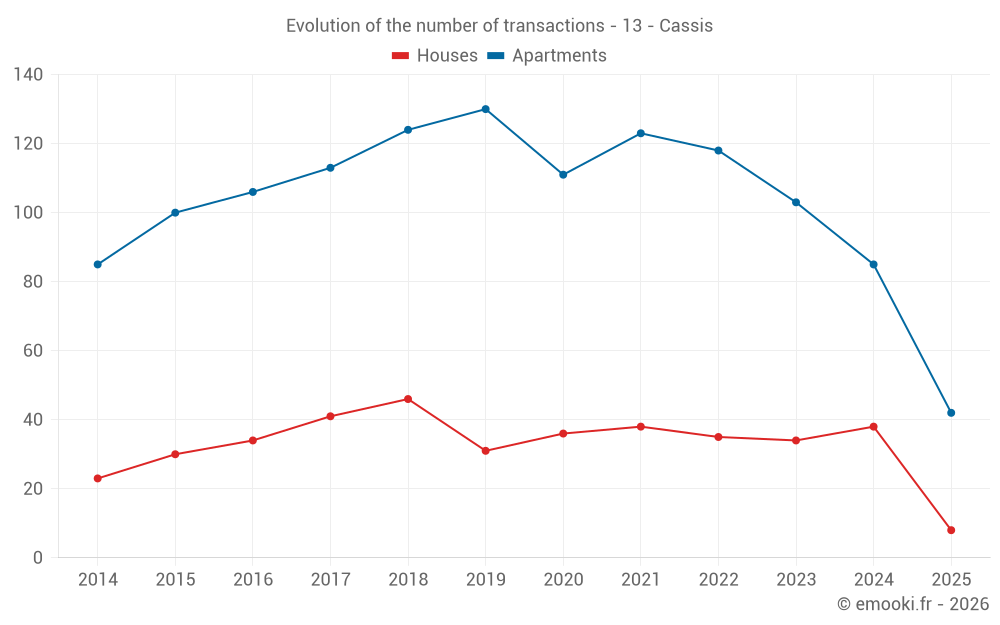
Median price on the 30 transactions of the last 12 months.
from 5 085 to
11 593 € /m²
60% of transactions from the 2nd to the 8th deciles.
ApartmentsApartments
7 274 € /m²
1-23-45-67-89-10
Reliability 9/10
Median price on the 42 transactions of the last 6 months.
from 5 264 to
9 030 € /m²
60% of transactions from the 2nd to the 8th deciles.
DwellingsDwellings
7 650 € /m²
1-23-45-67-89-10
Reliability 9/10
Median price on the 50 transactions of the last 6 months.
from 5 350 to
10 302 € /m²
60% of transactions from the 2nd to the 8th deciles.
HousesEvolution of the price per m² of houses since...
1 year
+21%
2 years
+19%
3 years
+22%
4 years
+25%
5 years
+72%
6 years
+82%
7 years
+76%
8 years
+66%
9 years
+65%
10 years
+74%
11 years
+78%
ApartmentsEvolution of the price per m² of apartments since...
1 year
-4.3%
2 years
+6.9%
3 years
+5.7%
4 years
+8.1%
5 years
+17%
6 years
+26%
7 years
+22%
8 years
+32%
9 years
+41%
10 years
+49%
11 years
+60%
The price per m² of apartments has decreased by 4.3% since 1 year, but it has increased by 60% in 11 years.

Yearly evolution

Evolution of the median price per m²

Evolution of the number of transactions

Warning, last year incomplete. Projections made based on the proportions between semesters of the previous year at the departmental/national level and by type of property.

Yearly data

Descending order
Year
Houses
house
transactions
Houses
house
Price per m²
Apartments
apt.
transactions
Apartments
apt.
Price per m²
2025
8
10 990 €
42
7 274 €
2024
38
9 086 €
85
7 604 €
2023
34
9 255 €
103
6 802 €
2022
35
9 040 €
118
6 881 €
2021
38
8 814 €
123
6 731 €
2020
36
6 384 €
111
6 210 €
2019
31
6 024 €
130
5 769 €
2018
46
6 250 €
124
5 950 €
2017
41
6 604 €
113
5 514 €
2016
34
6 644 €
106
5 166 €
2015
30
6 310 €
100
4 884 €
2014
23
6 176 €
85
4 545 €

Analysis

Structure of prices per m²

Values of price percentiles per m² over the periods used for the estimated price of each type of property.

Structure of transaction amounts

Values of transaction amounts percentiles over the periods used for the estimated price of each type of property.

Transaction amounts and prices per m² by percentile

Ascending order
Percentile
Houses
house
Price per m²
Houses
house
Transaction amount
Apartments
apt.
Price per m²
Apartments
apt.
Transaction amount
10th percentile
3 844 €
440 K€
4 586 €
191 K€
20th percentile
5 085 €
731 K€
5 264 €
220 K€
30th percentile
7 268 €
791 K€
5 990 €
233 K€
40th percentile
8 298 €
870 K€
6 378 €
331 K€
50th percentile
9 500 €
1 176 K€
7 274 €
385 K€
60th percentile
10 985 €
1 306 K€
7 833 €
420 K€
70th percentile
11 190 €
1 506 K€
8 153 €
474 K€
80th percentile
11 593 €
1 917 K€
9 030 €
593 K€
90th percentile
12 666 €
3 031 K€
11 610 €
828 K€

National and departmental comparison

Evolution of the median price per m² of houses

Evolution of the median price per m² of apartments

Quarterly evolution

Evolution of the median price per m²

Evolution of the number of transactions

Quarterly data

Descending order
Quarter
Houses
house
transactions
Houses
house
Price per m²
Apartments
apt.
transactions
Apartments
apt.
Price per m²
2025 Q2
3
11 017 €
16
6 795 €
2025 Q1
5
10 963 €
26
7 560 €
2024 Q4
9
7 513 €
23
7 538 €
2024 Q3
13
11 180 €
18
7 897 €
2024 Q2
4
6 783 €
20
6 893 €
2024 Q1
12
10 625 €
24
7 668 €
2023 Q4
10
8 188 €
25
7 096 €
2023 Q3
5
8 000 €
28
6 782 €
2023 Q2
11
10 389 €
22
6 680 €
2023 Q1
8
10 310 €
28
6 708 €
2022 Q4
9
5 497 €
24
6 446 €
2022 Q3
12
9 303 €
21
6 905 €
2022 Q2
10
10 544 €
40
6 966 €
2022 Q1
4
12 208 €
33
7 042 €
2021 Q4
13
9 343 €
32
7 290 €
2021 Q3
10
8 470 €
29
6 506 €
2021 Q2
4
6 288 €
29
5 946 €
2021 Q1
11
9 286 €
33
6 711 €
2020 Q4
19
7 003 €
40
6 491 €
2020 Q3
10
6 384 €
24
5 768 €
2020 Q2
2
5 915 €
13
5 160 €
2020 Q1
5
5 474 €
34
6 492 €
2019 Q4
10
7 194 €
27
5 737 €
2019 Q3
9
4 902 €
29
5 663 €
2019 Q2
4
6 882 €
37
5 682 €
2019 Q1
8
6 258 €
37
6 113 €
2018 Q4
11
6 829 €
42
6 170 €
2018 Q3
10
5 957 €
29
5 952 €
2018 Q2
13
6 410 €
24
5 658 €
2018 Q1
12
6 241 €
29
5 966 €
2017 Q4
18
6 162 €
21
5 563 €
2017 Q3
6
6 777 €
29
5 804 €
2017 Q2
14
6 636 €
26
5 312 €
2017 Q1
3
6 458 €
37
4 853 €
2016 Q4
12
5 906 €
30
5 437 €
2016 Q3
9
7 250 €
28
5 074 €
2016 Q2
8
7 876 €
24
5 202 €
2016 Q1
5
5 346 €
24
5 129 €
2015 Q4
7
7 480 €
34
4 731 €
2015 Q3
9
6 531 €
19
5 781 €
2015 Q2
9
7 386 €
20
4 279 €
2015 Q1
5
5 833 €
27
4 791 €
2014 Q4
14
6 815 €
22
4 248 €
2014 Q3
2
4 382 €
20
4 428 €
2014 Q2
3
5 135 €
22
4 624 €
2014 Q1
4
5 664 €
21
4 598 €

Overview of the latest real estate transactions

The following list is an anonymized overview of the latest transactions. For more details and to find all transactions, please use the map to view transactions by plot or the transaction search page for a search by criteria.

2025-06-30
515 000 €
9 364 € /m²(55 m²)
Sale
Apartments
Apartment
2 rooms
55 m2
2 outbuildings
2025-06-18
1 982 970 €
11 017 € /m²(180 m²)
Sale
Houses
House
5 rooms
180 m2
1 outbuilding
Land
3250 m2
-Sols
2025-06-13
475 000 €
7 917 € /m²(60 m²)
Sale
Apartments
Apartment
3 rooms
60 m2
2025-06-10
80 000 €
Sale
Land
3182 m2
-Terres
Land
7 m2
-Sols
Land
864 m2
-Bois
2025-06-10
225 000 €
5 357 € /m²(42 m²)
Sale
Apartments
Apartment
1 room
42 m2
2 outbuildings
2025-06-10
50 000 €
Sale
1 outbuilding
2025-06-06
570 000 €
8 507 € /m²(67 m²)
Sale
Apartments
Apartment
3 rooms
67 m2
1 outbuilding
2025-06-05
416 670 €
8 333 € /m²(50 m²)
Sale
Apartments
Apartment
2 rooms
50 m2
1 outbuilding
2025-06-03
447 000 €
5 321 € /m²(84 m²)
Sale
Apartments
Apartment
4 rooms
84 m2
2 outbuildings
2025-05-28
62 000 €
Sale
1 outbuilding
Land
24 m2
-Sols
2025-05-28
422 000 €
6 394 € /m²(66 m²)
Sale
Apartments
Apartment
4 rooms
66 m2
1 outbuilding
2025-05-27
220 000 €
7 097 € /m²(31 m²)
Sale
Apartments
Apartment
1 room
31 m2
1 outbuilding
2025-05-26
512 945 €
6 493 € /m²(79 m²)
Sale
Apartments
Apartment
4 rooms
79 m2
1 outbuilding
2025-05-21
75 000 €
Sale
1 outbuilding
2025-05-20
135 000 €
7 500 € /m²(18 m²)
Sale
Apartments
Apartment
1 room
18 m2
2025-05-19
300 000 €
6 250 € /m²(48 m²)
Sale
Apartments
Apartment
2 rooms
48 m2
1 outbuilding
2025-05-14
1 285 000 €
11 174 € /m²(115 m²)
Sale
1 outbuilding
Houses
House
5 rooms
115 m2
2 outbuildings
Land
680 m2
-Sols
Land
348 m2
-Sols
Land
12 m2
-Sols
Land
140 m2
-Sols
Land
168 m2
-Sols
2025-04-30
900 000 €
4 327 € /m²(208 m²)
8 911 € /m²(101 m²)
Sale
1 outbuilding
Land
4 m2
-Sols
Houses
House
3 rooms
61 m2
Commercial property
107 m2
Land
52 m2
-Sols
Apartments
Apartment
2 rooms
40 m2
2025-04-30
24 000 €
Sale
Land
139 m2
-Landes
Land
153 m2
-Landes
Land
136 m2
-Terres
2025-04-30
1 780 270 €
20 003 € /m²(89 m²)
Sale
2 outbuildings
Apartments
Apartment
3 rooms
89 m2
1 outbuilding

Bouches-du-Rhône (13)

Most expensive cities

City
name
Descending orderHouses
house
Price per m²
10 279 €
9 500 €
8 239 €
8 071 €
7 531 €
7 481 €
7 377 €
7 336 €
6 857 €
6 791 €
City
name
Descending orderApartments
apt.
Price per m²
7 564 €
7 274 €
7 009 €
5 908 €
5 427 €
5 274 €
5 051 €
5 022 €
5 020 €
4 950 €

Least expensive cities

City
name
Ascending orderHouses
house
Price per m²
2 212 €
2 338 €
2 365 €
2 513 €
2 574 €
2 652 €
2 692 €
2 756 €
2 786 €
2 865 €
City
name
Ascending orderApartments
apt.
Price per m²
1 120 €
1 248 €
1 352 €
1 494 €
1 500 €
1 655 €
1 730 €
1 806 €
1 838 €