Median price of real estate
in the municipality of Rians
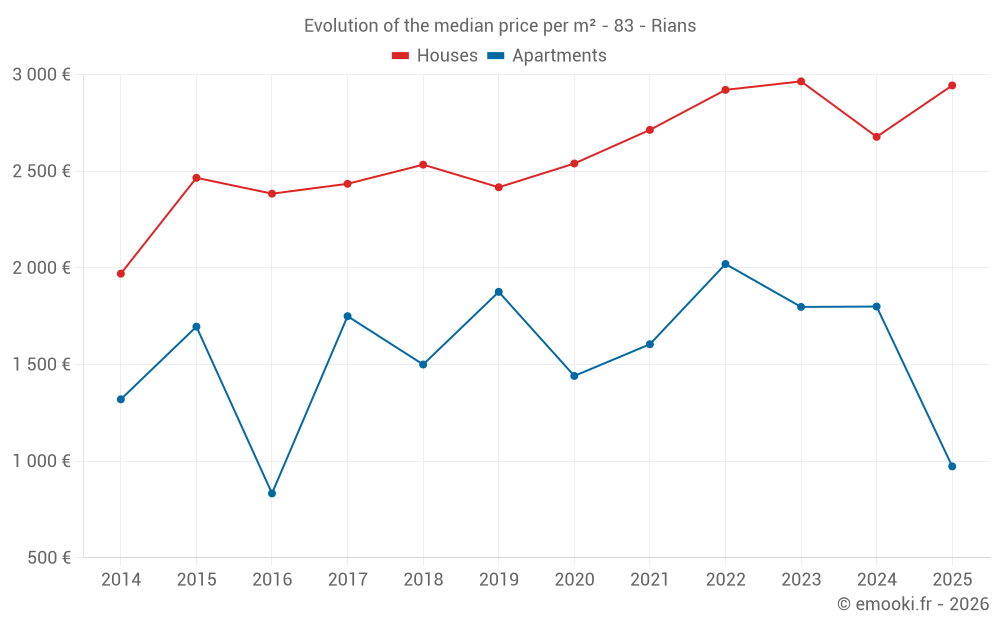
Houses
2 944 € /m²
Reliability 9/10
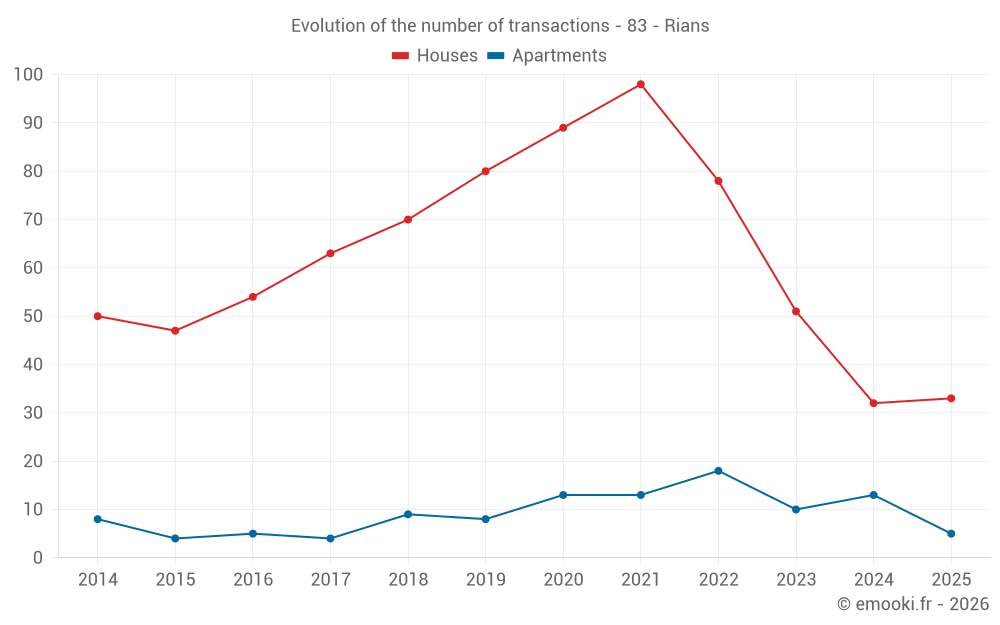
Median price on the 33 transactions of the last 6 months.
from 1 957 to
3 382 € /m²
3 382 € /m²
60% of transactions from the 2nd to the 8th deciles.
Apartments
1 784 € /m²
Reliability 7/10
Median price on the 23 transactions of the last 24 months.
from 1 219 to
2 452 € /m²
2 452 € /m²
60% of transactions from the 2nd to the 8th deciles.
Dwellings
2 834 € /m²
Reliability 9/10
Median price on the 38 transactions of the last 6 months.
from 1 336 to
3 382 € /m²
3 382 € /m²
60% of transactions from the 2nd to the 8th deciles.