emooki
HomePrice mapTransactions
🇬🇧 English🇫🇷 Français🇩🇪 Deutsch🇪🇸 Español🇮🇹 Italiano

Real estate price map


Real estate price map in the municipality of Marseille 2e Arrondissement, choose a section to see transactions by parcel.

Bouches-du-Rhône (13)
Marseille 2e Arrondissement

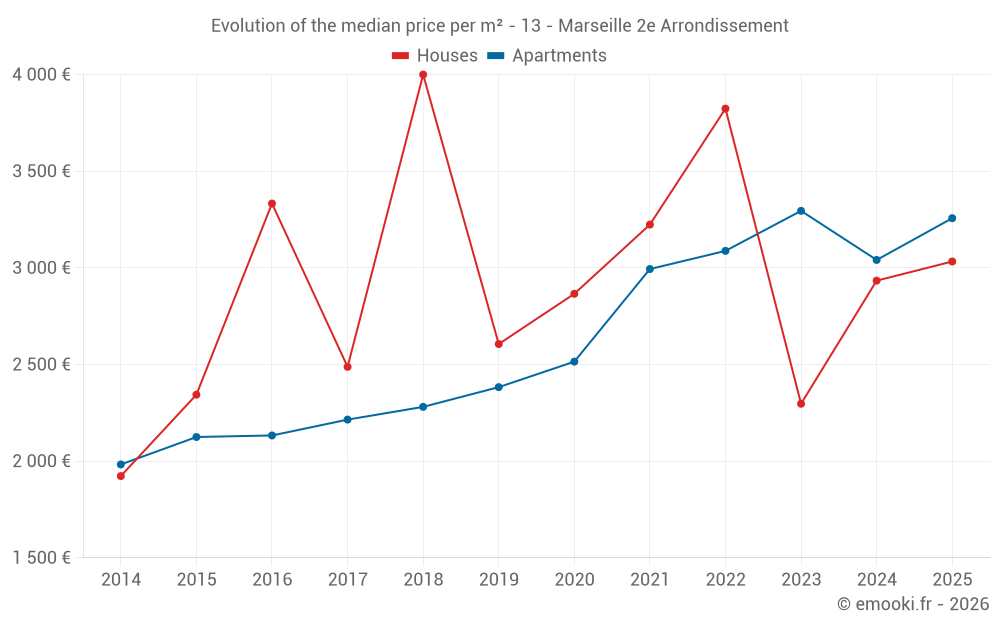
Median price of real estate
in the municipality of Marseille 2e Arrondissement

HousesHouses
2 365 € /m²
1-23-45-67-89-10
Reliability 7/10
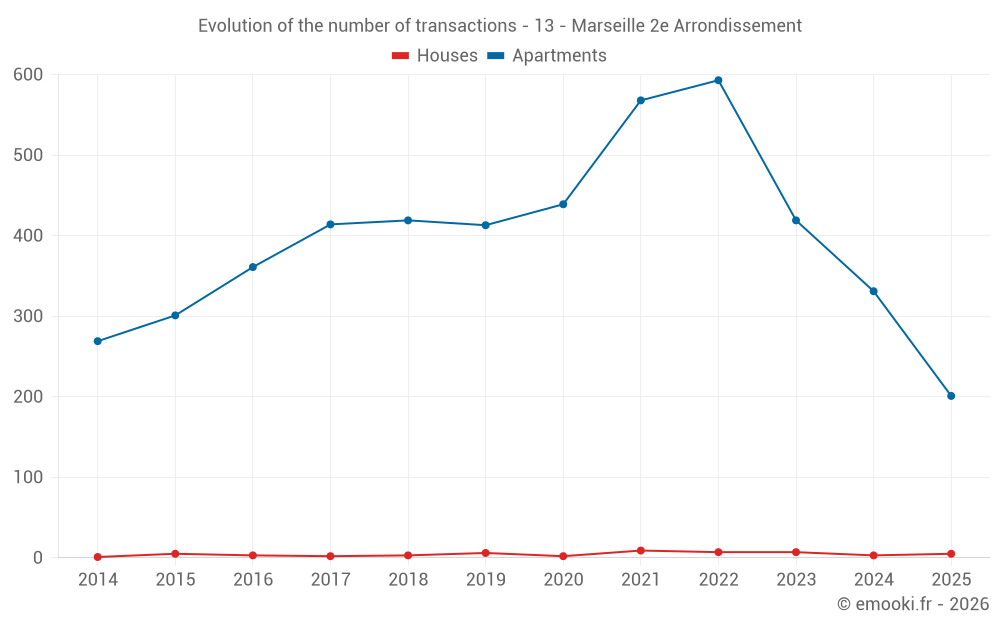
Median price on the 14 transactions of the last 24 months.
from 1 716 to
3 412 € /m²
60% of transactions from the 2nd to the 8th deciles.
ApartmentsApartments
3 329 € /m²
1-23-45-67-89-10
Reliability 10/10
Median price on the 103 transactions of the last 3 months.
from 2 368 to
4 525 € /m²
60% of transactions from the 2nd to the 8th deciles.
DwellingsDwellings
3 284 € /m²
1-23-45-67-89-10
Reliability 10/10
Median price on the 107 transactions of the last 3 months.
from 2 280 to
4 483 € /m²
60% of transactions from the 2nd to the 8th deciles.
HousesEvolution of the price per m² of houses since...
1 year
--
2 years
+32%
3 years
-21%
4 years
-5.9%
5 years
--
6 years
+16%
7 years
--
8 years
--
9 years
--
10 years
+29%
11 years
--
The price per m² of houses has increased by 32% since 2 years, but it has decreased by 21% in 3 years.
ApartmentsEvolution of the price per m² of apartments since...
1 year
+7.1%
2 years
-1.2%
3 years
+5.5%
4 years
+8.8%
5 years
+30%
6 years
+37%
7 years
+43%
8 years
+47%
9 years
+53%
10 years
+53%
11 years
+64%
The price per m² of apartments has decreased by 1.2% since 2 years, but it has increased by 64% in 11 years.

Yearly evolution

Evolution of the median price per m²

Evolution of the number of transactions

Warning, last year incomplete. Projections made based on the proportions between semesters of the previous year at the departmental/national level and by type of property.

Yearly data

Descending order
Year
Houses
house
transactions
Houses
house
Price per m²
Apartments
apt.
transactions
Apartments
apt.
Price per m²
2025
5
3 033 €
201
3 257 €
2024
3
2 934 €
331
3 041 €
2023
7
2 297 €
419
3 295 €
2022
7
3 824 €
593
3 088 €
2021
9
3 224 €
568
2 994 €
2020
2
2 866 €
439
2 515 €
2019
6
2 606 €
413
2 383 €
2018
3
4 000 €
419
2 281 €
2017
2
2 488 €
414
2 215 €
2016
3
3 333 €
361
2 133 €
2015
5
2 344 €
301
2 125 €
2014
1
1 923 €
269
1 983 €

Analysis

Structure of prices per m²

Values of price percentiles per m² over the periods used for the estimated price of each type of property.

Structure of transaction amounts

Values of transaction amounts percentiles over the periods used for the estimated price of each type of property.

Transaction amounts and prices per m² by percentile

Ascending order
Percentile
Houses
house
Price per m²
Houses
house
Transaction amount
Apartments
apt.
Price per m²
Apartments
apt.
Transaction amount
10th percentile
1 169 €
61 500 €
1 870 €
81 800 €
20th percentile
1 716 €
69 800 €
2 368 €
108 K€
30th percentile
1 821 €
84 700 €
2 714 €
124 K€
40th percentile
2 193 €
101 K€
2 987 €
134 K€
50th percentile
2 365 €
142 K€
3 329 €
142 K€
60th percentile
2 834 €
167 K€
3 561 €
158 K€
70th percentile
3 068 €
200 K€
3 946 €
186 K€
80th percentile
3 412 €
400 K€
4 525 €
219 K€
90th percentile
4 303 €
644 K€
5 674 €
284 K€

National and departmental comparison

Evolution of the median price per m² of houses

Evolution of the median price per m² of apartments

Quarterly evolution

Evolution of the median price per m²

Evolution of the number of transactions

Quarterly data

Descending order
Quarter
Houses
house
transactions
Houses
house
Price per m²
Apartments
apt.
transactions
Apartments
apt.
Price per m²
2025 Q2
4
2 600 €
103
3 329 €
2025 Q1
1
3 455 €
98
3 120 €
2024 Q4
1
1 749 €
86
3 042 €
2024 Q3
1
4 667 €
77
3 418 €
2024 Q2
1
2 934 €
93
2 653 €
2024 Q1
0
--- €
75
3 042 €
2023 Q4
1
759 €
82
3 278 €
2023 Q3
5
2 297 €
103
3 007 €
2023 Q2
0
--- €
108
3 222 €
2023 Q1
1
2 882 €
126
3 498 €
2022 Q4
1
3 789 €
121
3 333 €
2022 Q3
5
3 824 €
161
3 213 €
2022 Q2
1
4 000 €
156
3 205 €
2022 Q1
0
--- €
155
2 779 €
2021 Q4
1
3 000 €
141
2 985 €
2021 Q3
2
3 364 €
176
3 006 €
2021 Q2
4
3 560 €
141
2 959 €
2021 Q1
2
3 918 €
110
2 906 €
2020 Q4
0
--- €
143
2 705 €
2020 Q3
1
2 875 €
116
2 206 €
2020 Q2
1
2 857 €
89
2 906 €
2020 Q1
0
--- €
91
2 356 €
2019 Q4
0
--- €
118
2 530 €
2019 Q3
1
2 000 €
114
2 227 €
2019 Q2
3
3 011 €
100
2 382 €
2019 Q1
2
2 771 €
81
2 441 €
2018 Q4
0
--- €
86
2 258 €
2018 Q3
1
4 000 €
103
2 340 €
2018 Q2
1
3 481 €
121
2 286 €
2018 Q1
1
4 833 €
109
2 254 €
2017 Q4
0
--- €
95
2 182 €
2017 Q3
0
--- €
106
2 328 €
2017 Q2
2
2 488 €
121
2 178 €
2017 Q1
0
--- €
92
2 184 €
2016 Q4
1
3 038 €
89
2 480 €
2016 Q3
2
3 416 €
98
2 169 €
2016 Q2
0
--- €
82
2 182 €
2016 Q1
0
--- €
92
1 968 €
2015 Q4
0
--- €
78
2 238 €
2015 Q3
1
2 344 €
87
2 077 €
2015 Q2
1
2 653 €
68
2 086 €
2015 Q1
3
2 185 €
68
2 143 €
2014 Q4
1
1 923 €
58
2 092 €
2014 Q3
0
--- €
59
2 071 €
2014 Q2
0
--- €
78
1 950 €
2014 Q1
0
--- €
74
1 917 €

Overview of the latest real estate transactions

The following list is an anonymized overview of the latest transactions. For more details and to find all transactions, please use the map to view transactions by plot or the transaction search page for a search by criteria.

2025-06-30
10 004 724 €
4 261 € /m²(2348 m²)
Sale
Commercial property
2348 m2
Land
544 m2
-Sols
2025-06-27
54 000 €
1 543 € /m²(35 m²)
Sale
Apartments
Apartment
2 rooms
35 m2
2025-06-26
79 000 €
2 324 € /m²(34 m²)
Sale
Commercial property
12 m2
Commercial property
22 m2
2025-06-26
74 000 €
3 524 € /m²(21 m²)
Sale
Commercial property
21 m2
2025-06-26
83 000 €
2 441 € /m²(34 m²)
Sale
Commercial property
12 m2
Commercial property
22 m2
2025-06-25
10 312 888 €
Sale
2025-06-24
154 000 €
3 850 € /m²(40 m²)
Sale
Apartments
Apartment
2 rooms
40 m2
2025-06-24
257 000 €
3 213 € /m²(80 m²)
Sale
Apartments
Apartment
2 rooms
80 m2
1 outbuilding
1 outbuilding
2025-06-24
200 000 €
2 564 € /m²(78 m²)
Sale
Apartments
Apartment
4 rooms
78 m2
1 outbuilding
2025-06-24
15 000 €
Sale
1 outbuilding
2025-06-23
95 000 €
3 393 € /m²(28 m²)
Sale
Apartments
Apartment
1 room
28 m2
2025-06-20
120 000 €
4 444 € /m²(27 m²)
Sale
Commercial property
27 m2
2025-06-19
110 000 €
2 200 € /m²(50 m²)
Sale
Apartments
Apartment
2 rooms
50 m2
1 outbuilding
2025-06-19
242 000 €
2 814 € /m²(86 m²)
Sale
Apartments
Apartment
3 rooms
86 m2
2025-06-18
15 000 €
Sale
1 outbuilding
2025-06-17
52 000 €
1 576 € /m²(33 m²)
Sale
Apartments
Apartment
2 rooms
33 m2
2025-06-16
115 000 €
4 259 € /m²(27 m²)
Sale
Apartments
Apartment
1 room
27 m2
2025-06-16
1 €
Sale
Land
1742 m2
-Terrains à bâtir
Land
173 m2
-Terrains à bâtir
Land
107 m2
-Terrains à bâtir
Land
158 m2
-Sols
Land
1295 m2
-Landes
Land
248 m2
-Chemin de fer
2025-06-16
97 000 €
3 464 € /m²(28 m²)
Sale
Apartments
Apartment
28 m2
2025-06-13
40 000 €
1 143 € /m²(35 m²)
Sale
Apartments
Apartment
2 rooms
35 m2

Bouches-du-Rhône (13)

Most expensive cities

City
name
Descending orderHouses
house
Price per m²
10 279 €
9 500 €
8 239 €
8 071 €
7 531 €
7 481 €
7 377 €
7 336 €
6 857 €
6 791 €
City
name
Descending orderApartments
apt.
Price per m²
7 564 €
7 274 €
7 009 €
5 908 €
5 427 €
5 274 €
5 051 €
5 022 €
5 020 €
4 950 €

Least expensive cities

City
name
Ascending orderHouses
house
Price per m²
2 212 €
2 338 €
2 365 €
2 513 €
2 574 €
2 652 €
2 692 €
2 756 €
2 786 €
2 865 €
City
name
Ascending orderApartments
apt.
Price per m²
1 120 €
1 248 €
1 352 €
1 494 €
1 500 €
1 655 €
1 730 €
1 806 €
1 838 €