emooki
HomePrice mapTransactions
🇬🇧 English🇫🇷 Français🇩🇪 Deutsch🇪🇸 Español🇮🇹 Italiano

Real estate price map


Real estate price map in the municipality of Auriol, choose a section to see transactions by parcel.

Bouches-du-Rhône (13)
Auriol

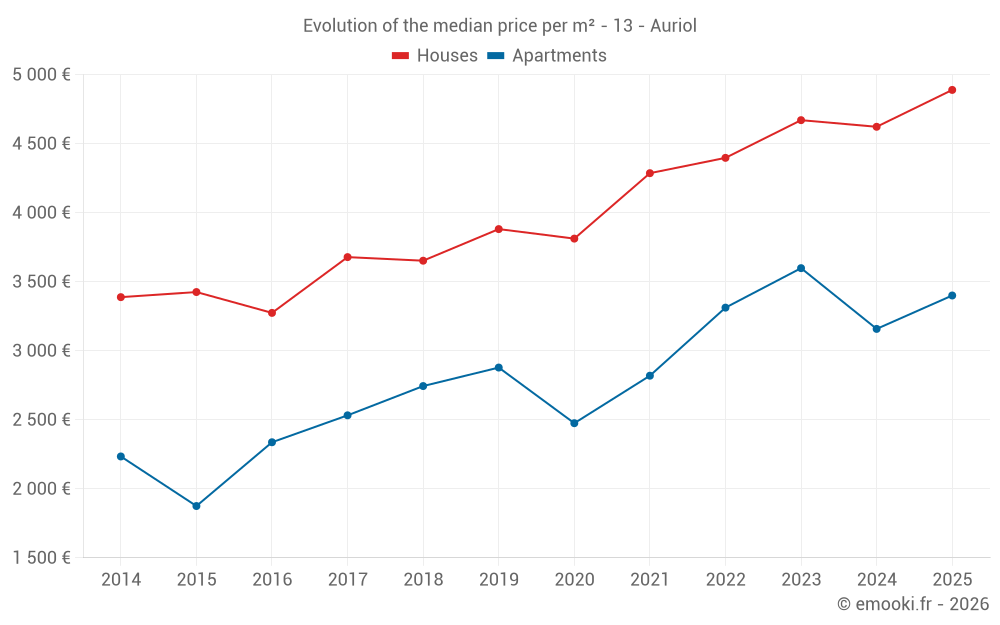
Median price of real estate
in the municipality of Auriol

HousesHouses
4 889 € /m²
1-23-45-67-89-10
Reliability 9/10
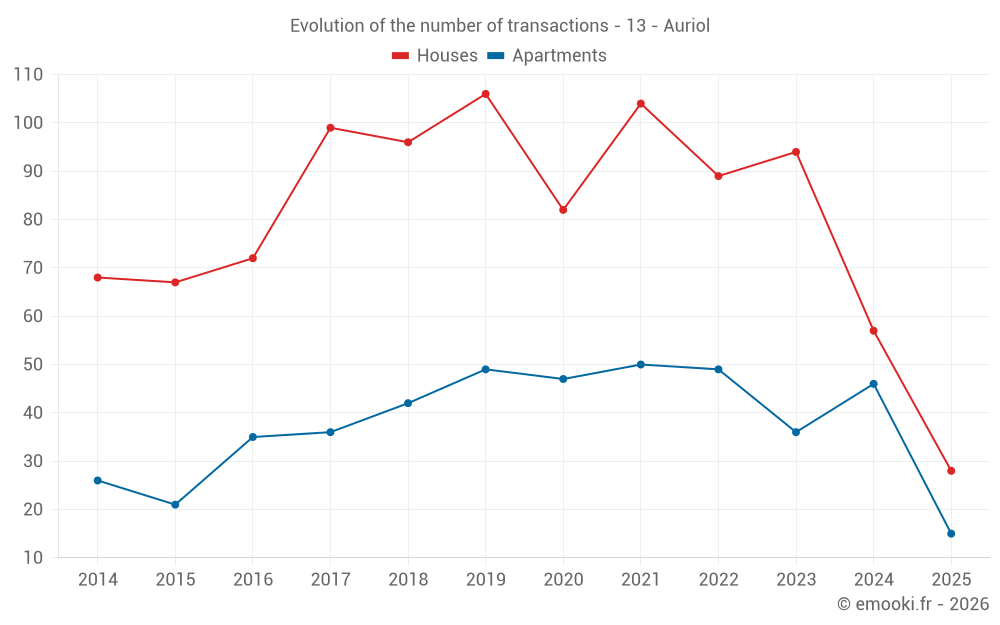
Median price on the 28 transactions of the last 6 months.
from 3 309 to
5 605 € /m²
60% of transactions from the 2nd to the 8th deciles.
ApartmentsApartments
3 158 € /m²
1-23-45-67-89-10
Reliability 8/10
Median price on the 34 transactions of the last 12 months.
from 1 916 to
4 277 € /m²
60% of transactions from the 2nd to the 8th deciles.
DwellingsDwellings
3 846 € /m²
1-23-45-67-89-10
Reliability 9/10
Median price on the 43 transactions of the last 6 months.
from 2 840 to
5 176 € /m²
60% of transactions from the 2nd to the 8th deciles.
HousesEvolution of the price per m² of houses since...
1 year
+5.8%
2 years
+4.7%
3 years
+11%
4 years
+14%
5 years
+28%
6 years
+26%
7 years
+34%
8 years
+33%
9 years
+49%
10 years
+43%
11 years
+44%
ApartmentsEvolution of the price per m² of apartments since...
1 year
+7.7%
2 years
-5.5%
3 years
+2.7%
4 years
+21%
5 years
+37%
6 years
+18%
7 years
+24%
8 years
+34%
9 years
+45%
10 years
+81%
11 years
+52%
The price per m² of apartments has decreased by 5.5% since 2 years, but it has increased by 81% in 10 years.

Yearly evolution

Evolution of the median price per m²

Evolution of the number of transactions

Warning, last year incomplete. Projections made based on the proportions between semesters of the previous year at the departmental/national level and by type of property.

Yearly data

Descending order
Year
Houses
house
transactions
Houses
house
Price per m²
Apartments
apt.
transactions
Apartments
apt.
Price per m²
2025
28
4 889 €
15
3 400 €
2024
57
4 622 €
46
3 158 €
2023
94
4 670 €
36
3 598 €
2022
89
4 397 €
49
3 312 €
2021
104
4 286 €
50
2 819 €
2020
82
3 812 €
47
2 475 €
2019
106
3 881 €
49
2 878 €
2018
96
3 652 €
42
2 744 €
2017
99
3 678 €
36
2 532 €
2016
72
3 274 €
35
2 337 €
2015
67
3 425 €
21
1 875 €
2014
68
3 388 €
26
2 234 €

Analysis

Structure of prices per m²

Values of price percentiles per m² over the periods used for the estimated price of each type of property.

Structure of transaction amounts

Values of transaction amounts percentiles over the periods used for the estimated price of each type of property.

Transaction amounts and prices per m² by percentile

Ascending order
Percentile
Houses
house
Price per m²
Houses
house
Transaction amount
Apartments
apt.
Price per m²
Apartments
apt.
Transaction amount
10th percentile
2 688 €
118 K€
1 576 €
83 600 €
20th percentile
3 309 €
225 K€
1 916 €
88 400 €
30th percentile
3 727 €
326 K€
2 510 €
114 K€
40th percentile
3 894 €
391 K€
2 799 €
135 K€
50th percentile
4 889 €
432 K€
3 158 €
174 K€
60th percentile
5 106 €
472 K€
3 412 €
214 K€
70th percentile
5 178 €
514 K€
3 625 €
225 K€
80th percentile
5 605 €
570 K€
4 277 €
278 K€
90th percentile
6 294 €
679 K€
4 560 €
324 K€

National and departmental comparison

Evolution of the median price per m² of houses

Evolution of the median price per m² of apartments

Quarterly evolution

Evolution of the median price per m²

Evolution of the number of transactions

Quarterly data

Descending order
Quarter
Houses
house
transactions
Houses
house
Price per m²
Apartments
apt.
transactions
Apartments
apt.
Price per m²
2025 Q2
12
5 156 €
5
2 796 €
2025 Q1
16
4 360 €
10
3 408 €
2024 Q4
13
4 373 €
15
3 035 €
2024 Q3
18
4 351 €
4
2 860 €
2024 Q2
9
4 667 €
11
3 040 €
2024 Q1
17
4 740 €
16
3 692 €
2023 Q4
22
4 898 €
9
3 596 €
2023 Q3
23
4 714 €
8
3 292 €
2023 Q2
17
3 846 €
5
4 152 €
2023 Q1
32
4 784 €
14
3 716 €
2022 Q4
19
4 028 €
12
3 674 €
2022 Q3
19
4 948 €
12
3 198 €
2022 Q2
21
4 543 €
15
3 377 €
2022 Q1
30
4 343 €
10
3 424 €
2021 Q4
22
4 418 €
10
2 940 €
2021 Q3
39
4 324 €
14
3 100 €
2021 Q2
20
4 484 €
15
2 273 €
2021 Q1
23
3 821 €
11
3 000 €
2020 Q4
30
3 832 €
17
2 433 €
2020 Q3
17
3 673 €
10
2 586 €
2020 Q2
17
5 039 €
8
1 788 €
2020 Q1
18
3 236 €
12
3 140 €
2019 Q4
22
4 288 €
9
3 000 €
2019 Q3
32
3 908 €
11
2 706 €
2019 Q2
23
3 571 €
15
2 453 €
2019 Q1
29
3 760 €
14
3 340 €
2018 Q4
27
3 809 €
8
2 808 €
2018 Q3
27
3 906 €
5
1 944 €
2018 Q2
23
3 499 €
17
2 805 €
2018 Q1
19
3 472 €
12
2 560 €
2017 Q4
21
3 261 €
6
2 912 €
2017 Q3
23
3 857 €
9
2 553 €
2017 Q2
26
3 824 €
9
2 400 €
2017 Q1
29
3 471 €
12
2 493 €
2016 Q4
19
3 315 €
9
2 586 €
2016 Q3
19
3 209 €
4
2 472 €
2016 Q2
18
2 977 €
9
2 300 €
2016 Q1
16
3 251 €
13
2 170 €
2015 Q4
17
3 208 €
6
1 682 €
2015 Q3
24
3 547 €
7
1 818 €
2015 Q2
14
3 594 €
7
1 875 €
2015 Q1
12
3 146 €
1
2 200 €
2014 Q4
14
3 041 €
6
2 230 €
2014 Q3
19
3 489 €
7
2 435 €
2014 Q2
23
3 422 €
11
2 077 €
2014 Q1
12
3 378 €
2
2 502 €

Overview of the latest real estate transactions

The following list is an anonymized overview of the latest transactions. For more details and to find all transactions, please use the map to view transactions by plot or the transaction search page for a search by criteria.

2025-06-30
469 000 €
5 863 € /m²(80 m²)
Sale
Houses
House
4 rooms
80 m2
Land
323 m2
-Sols
2025-06-25
729 800 €
7 298 € /m²(100 m²)
Sale
Houses
House
3 rooms
100 m2
2 outbuildings
Land
1500 m2
-Terrains d'agrément
Land
1500 m2
-Sols
Land
1287 m2
-Bois
2025-06-20
500 750 €
5 626 € /m²(89 m²)
Sale
Houses
House
4 rooms
89 m2
Land
2026 m2
-Sols
Land
207 m2
-Vignes
Land
101 m2
-Landes
2025-06-20
555 000 €
5 139 € /m²(108 m²)
Sale
Houses
House
5 rooms
108 m2
3 outbuildings
Land
1193 m2
-Sols
Land
2042 m2
-Terres
Land
551 m2
-Vergers
/Oliveraie ou oliviers
2025-06-18
439 920 €
4 999 € /m²(88 m²)
Sale
Houses
House
4 rooms
88 m2
Land
469 m2
-Sols
2025-06-09
135 000 €
2 700 € /m²(50 m²)
Sale
Apartments
Apartment
2 rooms
50 m2
3 outbuildings
2025-06-06
170 900 €
5 179 € /m²(33 m²)
Sale
1 outbuilding
Land
1050 m2
-Sols
Houses
House
2 rooms
33 m2
Land
48 m2
-Sols
Land
1714 m2
-Bois
Land
20 m2
-Landes
Land
1952 m2
-Vignes
Land
776 m2
-Vignes
2025-05-27
234 900 €
2 796 € /m²(84 m²)
Sale
Apartments
Apartment
4 rooms
84 m2
1 outbuilding
2025-05-24
656 880 €
5 172 € /m²(127 m²)
Sale
Houses
House
5 rooms
127 m2
1 outbuilding
Land
700 m2
-Sols
2025-05-23
86 000 €
2 457 € /m²(35 m²)
Sale
Apartments
Apartment
2 rooms
35 m2
1 outbuilding
2025-05-19
296 200 €
4 356 € /m²(68 m²)
Sale
Apartments
Apartment
3 rooms
68 m2
2 outbuildings
2025-05-12
22 002 €
Sale
Land
1565 m2
-Bois
Land
2048 m2
-Terres
Land
2310 m2
-Vignes
Land
485 m2
-Vignes
Land
846 m2
-Vergers
/Oliveraie ou oliviers
Land
21320 m2
-Bois
2025-04-30
293 000 €
2 930 € /m²(100 m²)
Sale
Commercial property
100 m2
Land
156 m2
-Sols
2025-04-30
425 000 €
3 269 € /m²(130 m²)
Sale
Houses
House
6 rooms
130 m2
Land
1071 m2
-Sols
Land
932 m2
-Sols
2025-04-29
355 000 €
Sale
Land
309 m2
-Terres
Land
687 m2
-Terres
2025-04-29
115 000 €
3 594 € /m²(32 m²)
Sale
Apartments
Apartment
2 rooms
32 m2
2025-04-25
580 000 €
5 743 € /m²(101 m²)
Sale
Houses
House
5 rooms
101 m2
1 outbuilding
Land
4533 m2
-Terres
Land
1000 m2
-Sols
2025-04-18
380 000 €
3 725 € /m²(102 m²)
Sale
Houses
House
5 rooms
102 m2
1 outbuilding
Land
934 m2
-Sols
Land
5449 m2
-Vignes
Land
717 m2
-Bois
2025-04-11
551 450 €
3 244 € /m²(170 m²)
Sale
Houses
House
4 rooms
170 m2
2 outbuildings
Land
576 m2
-Sols
Land
3891 m2
-Terres
2025-04-03
20 000 €
208 € /m²(96 m²)
Sale
1 outbuilding
Houses
House
5 rooms
96 m2
Land
32 m2
-Sols

Bouches-du-Rhône (13)

Most expensive cities

City
name
Descending orderHouses
house
Price per m²
10 279 €
9 500 €
8 239 €
8 071 €
7 531 €
7 481 €
7 377 €
7 336 €
6 857 €
6 791 €
City
name
Descending orderApartments
apt.
Price per m²
7 564 €
7 274 €
7 009 €
5 908 €
5 427 €
5 274 €
5 051 €
5 022 €
5 020 €
4 950 €

Least expensive cities

City
name
Ascending orderHouses
house
Price per m²
2 212 €
2 338 €
2 365 €
2 513 €
2 574 €
2 652 €
2 692 €
2 756 €
2 786 €
2 865 €
City
name
Ascending orderApartments
apt.
Price per m²
1 120 €
1 248 €
1 352 €
1 494 €
1 500 €
1 655 €
1 730 €
1 806 €
1 838 €