emooki
HomePrice mapTransactions
🇬🇧 English🇫🇷 Français🇩🇪 Deutsch🇪🇸 Español🇮🇹 Italiano

Real estate price map


Real estate price map in the municipality of Martigues.

Bouches-du-Rhône (13)
Martigues

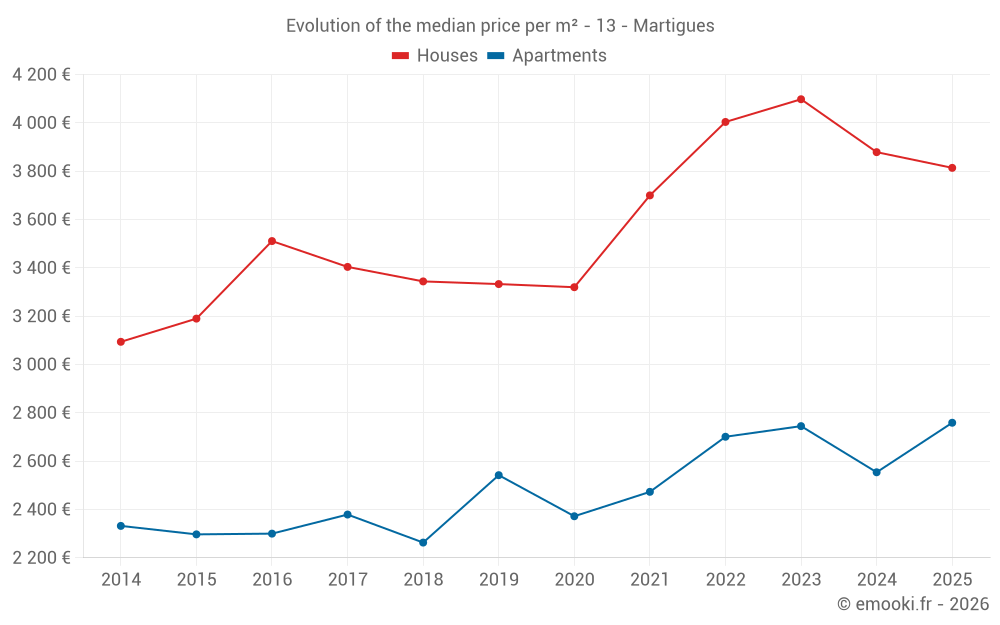
Median price of real estate
in the municipality of Martigues

HousesHouses
3 957 € /m²
1-23-45-67-89-10
Reliability 10/10
Median price on the 38 transactions of the last 3 months.
from 2 599 to
5 063 € /m²
60% of transactions from the 2nd to the 8th deciles.
ApartmentsApartments
2 759 € /m²
1-23-45-67-89-10
Reliability 10/10
Median price on the 51 transactions of the last 3 months.
from 2 133 to
3 605 € /m²
60% of transactions from the 2nd to the 8th deciles.
DwellingsDwellings
3 047 € /m²
1-23-45-67-89-10
Reliability 10/10
Median price on the 89 transactions of the last 3 months.
from 2 162 to
4 240 € /m²
60% of transactions from the 2nd to the 8th deciles.
HousesEvolution of the price per m² of houses since...
1 year
-1.7%
2 years
-6.9%
3 years
-4.7%
4 years
+3.1%
5 years
+15%
6 years
+14%
7 years
+14%
8 years
+12%
9 years
+8.6%
10 years
+20%
11 years
+23%
ApartmentsEvolution of the price per m² of apartments since...
1 year
+8%
2 years
+0.5%
3 years
+2.1%
4 years
+12%
5 years
+16%
6 years
+8.5%
7 years
+22%
8 years
+16%
9 years
+20%
10 years
+20%
11 years
+18%

Yearly evolution

Evolution of the median price per m²

Evolution of the number of transactions

Warning, last year incomplete. Projections made based on the proportions between semesters of the previous year at the departmental/national level and by type of property.

Yearly data

Descending order
Year
Houses
house
transactions
Houses
house
Price per m²
Apartments
apt.
transactions
Apartments
apt.
Price per m²
2025
85
3 814 €
135
2 759 €
2024
189
3 879 €
298
2 554 €
2023
184
4 098 €
333
2 745 €
2022
218
4 004 €
401
2 701 €
2021
245
3 700 €
406
2 473 €
2020
202
3 320 €
337
2 372 €
2019
209
3 333 €
342
2 542 €
2018
200
3 344 €
335
2 263 €
2017
205
3 404 €
316
2 379 €
2016
174
3 511 €
281
2 300 €
2015
190
3 190 €
291
2 297 €
2014
158
3 094 €
232
2 332 €

Analysis

Structure of prices per m²

Values of price percentiles per m² over the periods used for the estimated price of each type of property.

Structure of transaction amounts

Values of transaction amounts percentiles over the periods used for the estimated price of each type of property.

Transaction amounts and prices per m² by percentile

Ascending order
Percentile
Houses
house
Price per m²
Houses
house
Transaction amount
Apartments
apt.
Price per m²
Apartments
apt.
Transaction amount
10th percentile
1 783 €
140 K€
1 875 €
85 000 €
20th percentile
2 599 €
189 K€
2 133 €
98 000 €
30th percentile
2 946 €
240 K€
2 261 €
130 K€
40th percentile
3 301 €
257 K€
2 484 €
142 K€
50th percentile
3 957 €
351 K€
2 759 €
160 K€
60th percentile
4 245 €
385 K€
2 926 €
169 K€
70th percentile
4 670 €
430 K€
3 264 €
186 K€
80th percentile
5 063 €
450 K€
3 605 €
214 K€
90th percentile
5 761 €
472 K€
3 980 €
267 K€

National and departmental comparison

Evolution of the median price per m² of houses

Evolution of the median price per m² of apartments

Quarterly evolution

Evolution of the median price per m²

Evolution of the number of transactions

Quarterly data

Descending order
Quarter
Houses
house
transactions
Houses
house
Price per m²
Apartments
apt.
transactions
Apartments
apt.
Price per m²
2025 Q2
38
3 957 €
51
2 759 €
2025 Q1
47
3 732 €
84
2 778 €
2024 Q4
48
3 943 €
64
2 508 €
2024 Q3
50
3 884 €
90
2 573 €
2024 Q2
44
3 822 €
79
2 577 €
2024 Q1
47
4 000 €
65
2 559 €
2023 Q4
49
3 876 €
61
2 852 €
2023 Q3
46
4 139 €
74
2 810 €
2023 Q2
38
4 268 €
95
2 667 €
2023 Q1
51
4 115 €
103
2 709 €
2022 Q4
45
4 093 €
81
2 861 €
2022 Q3
74
3 924 €
111
2 767 €
2022 Q2
46
3 963 €
128
2 627 €
2022 Q1
53
3 864 €
81
2 583 €
2021 Q4
59
3 812 €
106
2 444 €
2021 Q3
73
4 000 €
117
2 597 €
2021 Q2
56
3 540 €
93
2 420 €
2021 Q1
57
3 422 €
90
2 448 €
2020 Q4
71
3 288 €
102
2 384 €
2020 Q3
50
3 234 €
86
2 364 €
2020 Q2
44
3 576 €
68
2 268 €
2020 Q1
37
3 333 €
81
2 490 €
2019 Q4
55
3 414 €
91
2 569 €
2019 Q3
67
3 439 €
91
2 826 €
2019 Q2
46
3 066 €
88
2 444 €
2019 Q1
41
3 474 €
72
2 323 €
2018 Q4
42
3 626 €
92
2 450 €
2018 Q3
60
3 232 €
78
2 280 €
2018 Q2
44
3 270 €
92
2 268 €
2018 Q1
54
3 532 €
73
2 051 €
2017 Q4
50
3 500 €
92
2 294 €
2017 Q3
55
3 432 €
74
2 452 €
2017 Q2
49
3 415 €
82
2 434 €
2017 Q1
51
3 149 €
68
2 286 €
2016 Q4
45
3 559 €
74
2 280 €
2016 Q3
48
3 404 €
74
2 480 €
2016 Q2
36
3 134 €
60
2 298 €
2016 Q1
45
3 652 €
73
2 159 €
2015 Q4
46
3 356 €
78
2 112 €
2015 Q3
60
3 113 €
93
2 366 €
2015 Q2
49
3 136 €
72
2 302 €
2015 Q1
35
3 235 €
48
2 377 €
2014 Q4
29
3 469 €
62
2 324 €
2014 Q3
40
3 045 €
60
2 426 €
2014 Q2
42
3 160 €
69
2 303 €
2014 Q1
47
2 941 €
41
2 289 €

Bouches-du-Rhône (13)

Most expensive cities

City
name
Descending orderHouses
house
Price per m²
10 279 €
9 500 €
8 239 €
8 071 €
7 531 €
7 481 €
7 377 €
7 336 €
6 857 €
6 791 €
City
name
Descending orderApartments
apt.
Price per m²
7 564 €
7 274 €
7 009 €
5 908 €
5 427 €
5 274 €
5 051 €
5 022 €
5 020 €
4 950 €

Least expensive cities

City
name
Ascending orderHouses
house
Price per m²
2 212 €
2 338 €
2 365 €
2 513 €
2 574 €
2 652 €
2 692 €
2 756 €
2 786 €
2 865 €
City
name
Ascending orderApartments
apt.
Price per m²
1 120 €
1 248 €
1 352 €
1 494 €
1 500 €
1 655 €
1 730 €
1 806 €
1 838 €