emooki
HomePrice mapTransactions
🇬🇧 English🇫🇷 Français🇩🇪 Deutsch🇪🇸 Español🇮🇹 Italiano

Real estate price map


Real estate price map in the Meuse department.

Department 55
Meuse

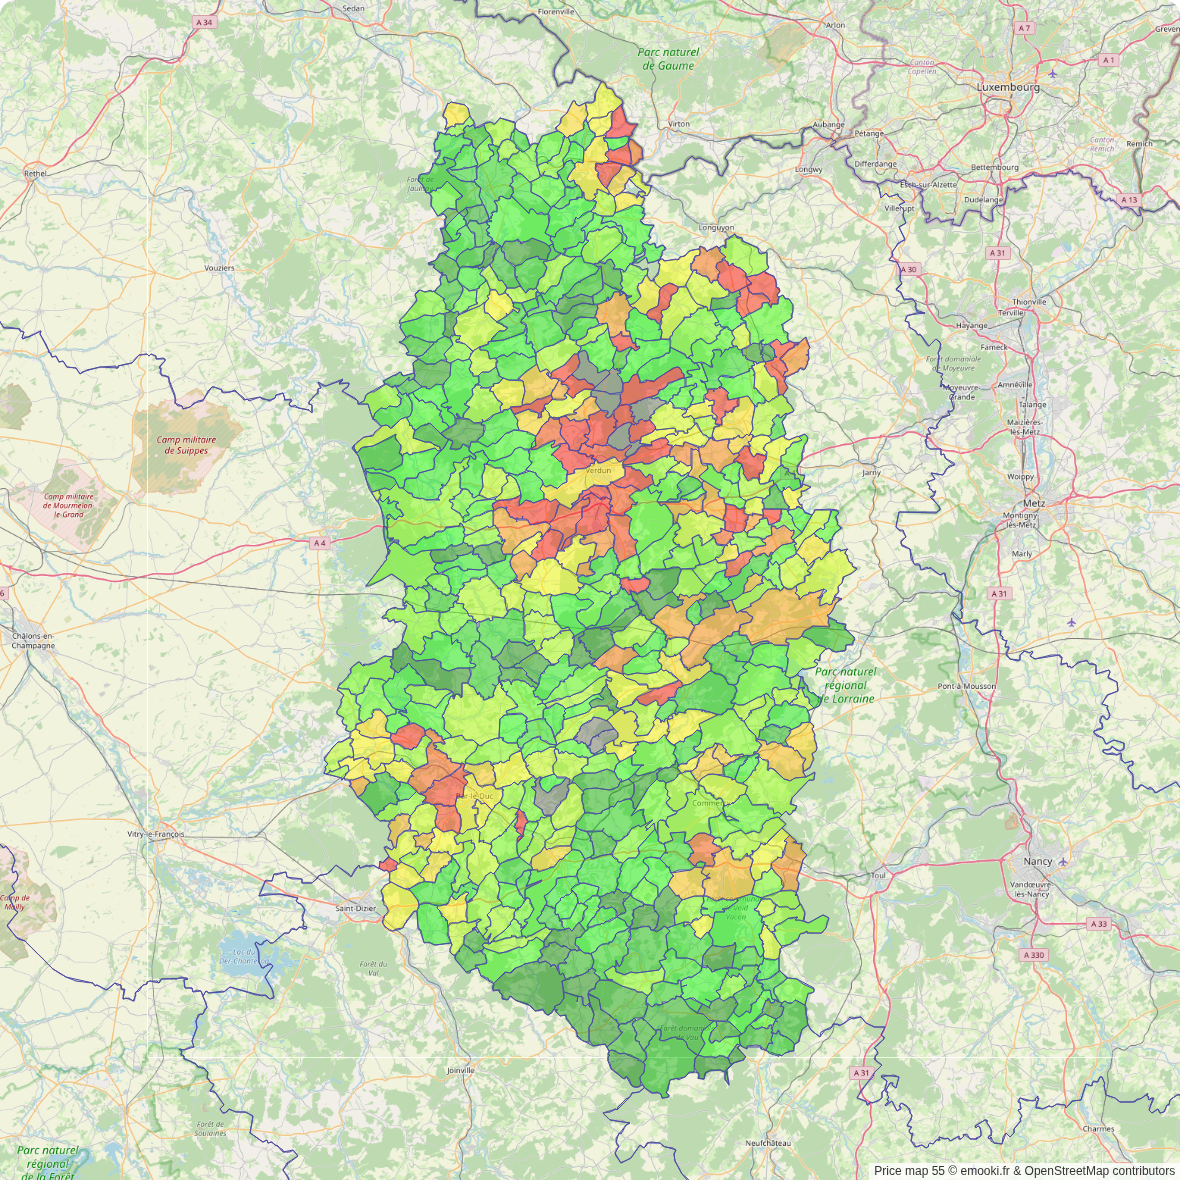
Median price of real estate
in the Meuse department

HousesHouses
1 006 € /m²
1-23-45-67-89-10
Reliability 10/10
Median price on the 228 transactions of the last 3 months.
from 547 to
1 616 € /m²
60% of transactions from the 2nd to the 8th deciles.
ApartmentsApartments
903 € /m²
1-23-45-67-89-10
Reliability 9/10
Median price on the 121 transactions of the last 6 months.
from 522 to
1 354 € /m²
60% of transactions from the 2nd to the 8th deciles.
DwellingsDwellings
1 000 € /m²
1-23-45-67-89-10
Reliability 10/10
Median price on the 270 transactions of the last 3 months.
from 550 to
1 605 € /m²
60% of transactions from the 2nd to the 8th deciles.
HousesEvolution of the price per m² of houses since...
1 year
0%
2 years
0%
3 years
-2.3%
4 years
+7.5%
5 years
+8%
6 years
+16%
7 years
+10%
8 years
+13%
9 years
+14%
10 years
+13%
11 years
+12%
ApartmentsEvolution of the price per m² of apartments since...
1 year
-4.8%
2 years
-5.8%
3 years
-4.6%
4 years
-0.1%
5 years
+1.7%
6 years
+13%
7 years
+11%
8 years
+8.4%
9 years
+28%
10 years
+31%
11 years
+5.9%

Yearly evolution

Evolution of the median price per m²

Evolution of the number of transactions

Warning, last year incomplete. Projections made based on the proportions between semesters of the previous year at the departmental/national level and by type of property.

Yearly data

Descending order
Year
Houses
house
transactions
Houses
house
Price per m²
Apartments
apt.
transactions
Apartments
apt.
Price per m²
2025
636
1 000 €
121
903 €
2024
1 737
1 000 €
331
949 €
2023
1 957
1 000 €
297
959 €
2022
2 380
1 024 €
387
947 €
2021
2 412
930 €
388
904 €
2020
2 044
926 €
346
888 €
2019
2 152
860 €
315
800 €
2018
1 870
912 €
271
814 €
2017
1 869
887 €
291
833 €
2016
1 598
876 €
258
706 €
2015
1 493
887 €
239
688 €
2014
1 364
890 €
268
853 €

Analysis

Structure of prices per m²

Values of price percentiles per m² over the periods used for the estimated price of each type of property.

Structure of transaction amounts

Values of transaction amounts percentiles over the periods used for the estimated price of each type of property.

Transaction amounts and prices per m² by percentile

Ascending order
Percentile
Houses
house
Price per m²
Houses
house
Transaction amount
Apartments
apt.
Price per m²
Apartments
apt.
Transaction amount
10th percentile
347 €
28 000 €
346 €
33 000 €
20th percentile
547 €
46 200 €
522 €
48 000 €
30th percentile
681 €
67 010 €
636 €
57 600 €
40th percentile
854 €
89 400 €
767 €
64 600 €
50th percentile
1 006 €
114 K€
903 €
77 750 €
60th percentile
1 127 €
130 K€
1 045 €
88 000 €
70th percentile
1 443 €
146 K€
1 158 €
98 300 €
80th percentile
1 616 €
164 K€
1 354 €
112 K€
90th percentile
1 855 €
193 K€
1 517 €
157 K€

Quarterly evolution

Evolution of the median price per m²

Evolution of the number of transactions

Quarterly data

Descending order
Quarter
Houses
house
transactions
Houses
house
Price per m²
Apartments
apt.
transactions
Apartments
apt.
Price per m²
2025 Q2
228
1 006 €
42
926 €
2025 Q1
408
996 €
79
897 €
2024 Q4
507
973 €
92
946 €
2024 Q3
494
1 059 €
84
910 €
2024 Q2
394
969 €
85
951 €
2024 Q1
342
944 €
70
1 033 €
2023 Q4
521
942 €
76
925 €
2023 Q3
493
1 128 €
77
954 €
2023 Q2
501
961 €
82
998 €
2023 Q1
442
984 €
62
1 015 €
2022 Q4
555
1 056 €
88
950 €
2022 Q3
675
1 063 €
111
965 €
2022 Q2
617
1 000 €
100
940 €
2022 Q1
533
984 €
88
959 €
2021 Q4
613
983 €
82
980 €
2021 Q3
710
964 €
112
948 €
2021 Q2
604
874 €
103
906 €
2021 Q1
485
879 €
91
795 €
2020 Q4
695
938 €
111
920 €
2020 Q3
567
971 €
73
814 €
2020 Q2
387
891 €
78
909 €
2020 Q1
395
872 €
84
828 €
2019 Q4
584
817 €
74
806 €
2019 Q3
585
940 €
87
804 €
2019 Q2
504
833 €
83
792 €
2019 Q1
479
843 €
71
816 €
2018 Q4
544
950 €
76
730 €
2018 Q3
517
911 €
67
814 €
2018 Q2
446
890 €
65
852 €
2018 Q1
363
873 €
63
889 €
2017 Q4
468
882 €
66
840 €
2017 Q3
516
924 €
67
756 €
2017 Q2
447
889 €
82
940 €
2017 Q1
438
816 €
76
704 €
2016 Q4
399
868 €
64
659 €
2016 Q3
473
900 €
51
740 €
2016 Q2
375
850 €
74
720 €
2016 Q1
351
875 €
69
613 €
2015 Q4
460
853 €
58
600 €
2015 Q3
408
904 €
73
771 €
2015 Q2
365
908 €
57
567 €
2015 Q1
260
892 €
51
920 €
2014 Q4
344
815 €
58
836 €
2014 Q3
401
941 €
81
817 €
2014 Q2
323
896 €
52
979 €
2014 Q1
296
870 €
77
846 €

Meuse (55)

Most expensive cities

City
name
Descending orderHouses
house
Price per m²
5 577 €
1 815 €
1 759 €
1 742 €
1 724 €
1 715 €
1 676 €
1 649 €
1 618 €
1 606 €
City
name
Descending orderApartments
apt.
Price per m²
2 375 €
2 000 €
1 684 €
1 444 €
1 280 €
1 264 €
1 212 €
1 205 €
1 192 €
1 183 €

Least expensive cities

City
name
Ascending orderHouses
house
Price per m²
130 €
150 €
160 €
212 €
250 €
268 €
272 €
287 €
287 €
304 €
City
name
Ascending orderApartments
apt.
Price per m²
1 €
86 €
106 €
119 €
132 €
133 €
144 €
149 €