emooki
HomePrice mapTransactions
🇬🇧 English🇫🇷 Français🇩🇪 Deutsch🇪🇸 Español🇮🇹 Italiano

Real estate price map


Real estate price map in the municipality of Badonvilliers-Gérauvilliers.

Meuse (55)
Badonvilliers-Gérauvilliers

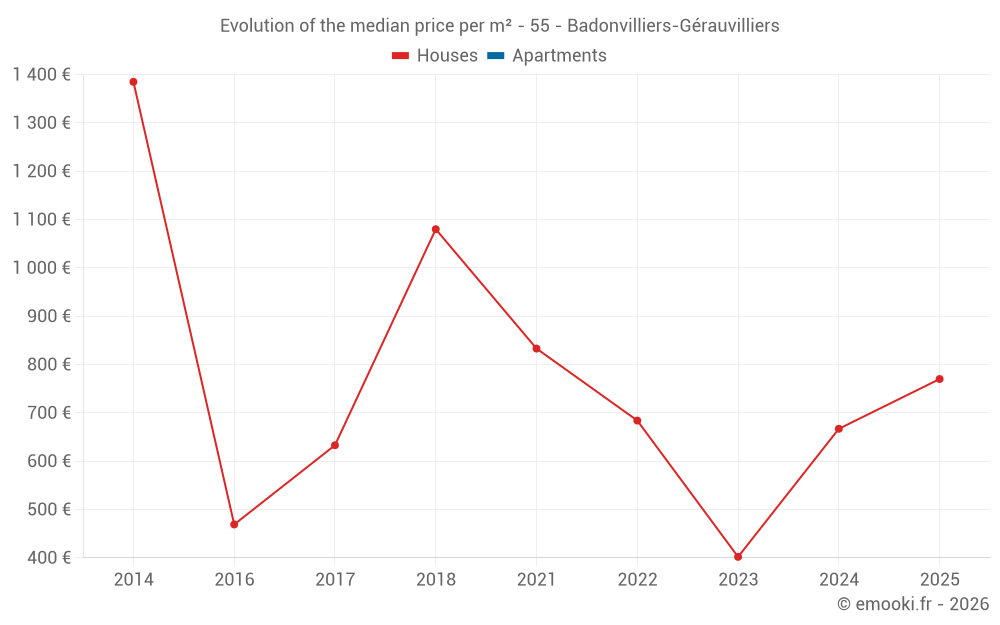
Median price of real estate
in the municipality of Badonvilliers-Gérauvilliers

HousesHouses
716  /m²
1-23-45-67-89-10
Reliability 4/10
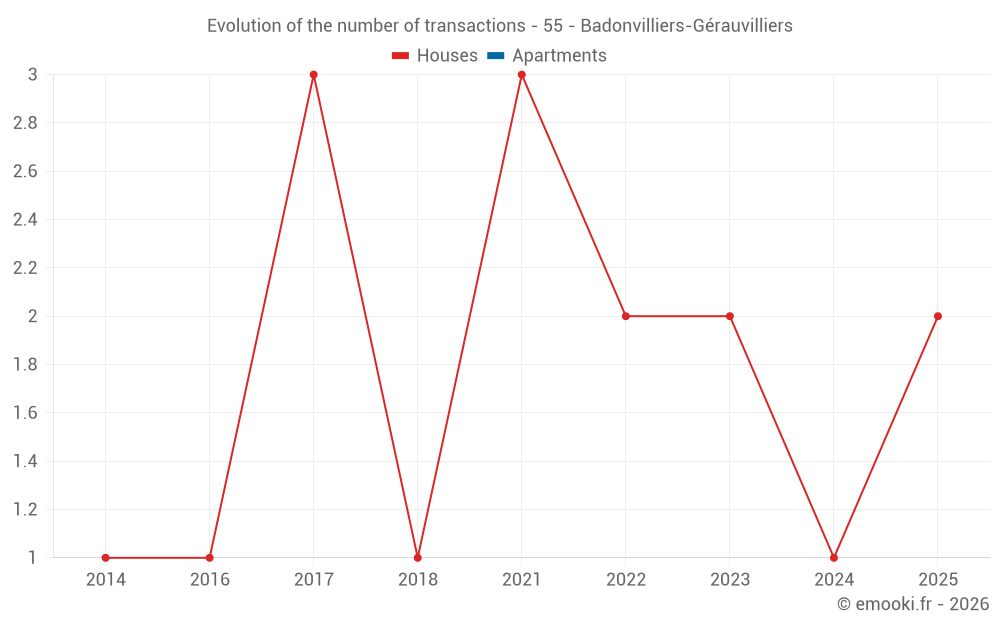
Median price on the 10 transactions of the last 60 months.
HousesEvolution of the price per m² of houses since...
1 year
--
2 years
--
3 years
--
4 years
--
5 years
--
6 years
--
7 years
--
8 years
--
9 years
--
10 years
--
11 years
--
ApartmentsEvolution of the price per m² of apartments since...
1 year
--
2 years
--
3 years
--
4 years
--
5 years
--
6 years
--
7 years
--
8 years
--
9 years
--
10 years
--
11 years
--

Yearly evolution

Evolution of the median price per m²

Evolution of the number of transactions

Warning, last year incomplete. Projections made based on the proportions between semesters of the previous year at the departmental/national level and by type of property.

Yearly data

Descending order
Year
Houses
house
transactions
Houses
house
Price per m²
Apartments
apt.
transactions
Apartments
apt.
Price per m²
2025
2
770 
0
--- 
2024
1
667 
0
--- 
2023
2
402 
0
--- 
2022
2
684 
0
--- 
2021
3
833 
0
--- 
2020
0
--- 
0
--- 
2019
0
--- 
0
--- 
2018
1
1 080 
0
--- 
2017
3
633 
0
--- 
2016
1
469 
0
--- 
2015
0
--- 
0
--- 
2014
1
1 385 
0
--- 

Analysis

Structure of prices per m²

Values of price percentiles per m² over the periods used for the estimated price of each type of property.

Structure of transaction amounts

Values of transaction amounts percentiles over the periods used for the estimated price of each type of property.

Transaction amounts and prices per m² by percentile

Ascending order
Percentile
Houses
house
Price per m²
Houses
house
Transaction amount
Apartments
apt.
Price per m²
Apartments
apt.
Transaction amount
10th percentile
347 
28 100 
--- 
--- 
20th percentile
601 
29 400 
--- 
--- 
30th percentile
665 
43 850 
--- 
--- 
40th percentile
683 
50 000 
--- 
--- 
50th percentile
716 
67 500 
--- 
--- 
60th percentile
763 
95 000 
--- 
--- 
70th percentile
810 
115 K
--- 
--- 
80th percentile
866 
128 K
--- 
--- 
90th percentile
1 055 
129 K
--- 
--- 

National and departmental comparison

Evolution of the median price per m² of houses

Evolution of the median price per m² of apartments

Quarterly evolution

Evolution of the median price per m²

Evolution of the number of transactions

Quarterly data

Descending order
Quarter
Houses
house
transactions
Houses
house
Price per m²
Apartments
apt.
transactions
Apartments
apt.
Price per m²
2025 Q1
2
770 
0
--- 
2024 Q1
1
667 
0
--- 
2023 Q4
1
145 
0
--- 
2023 Q3
1
659 
0
--- 
2022 Q4
1
369 
0
--- 
2022 Q2
1
1 000 
0
--- 
2021 Q4
1
1 549 
0
--- 
2021 Q2
2
764 
0
--- 
2018 Q4
1
1 080 
0
--- 
2017 Q4
1
633 
0
--- 
2017 Q2
2
610 
0
--- 
2016 Q1
1
469 
0
--- 
2014 Q2
1
1 385 
0
--- 

Meuse (55)

Most expensive cities

City
name
Descending orderHouses
house
Price per m²
5 577 
1 815 
1 742 
1 715 
1 676 
1 649 
1 618 
1 606 
City
name
Descending orderApartments
apt.
Price per m²
2 375 
2 000 
1 684 
1 280 
1 264 
1 205 
1 192 
1 183 

Least expensive cities

City
name
Ascending orderHouses
house
Price per m²
150 
212 
268 
272 
287 
287 
City
name
Ascending orderApartments
apt.
Price per m²
1 
133 
149