emooki
HomePrice mapTransactions
🇬🇧 English🇫🇷 Français🇩🇪 Deutsch🇪🇸 Español🇮🇹 Italiano

Real estate price map


Real estate price map in the municipality of Bouligny, choose a section to see transactions by parcel.

Meuse (55)
Bouligny

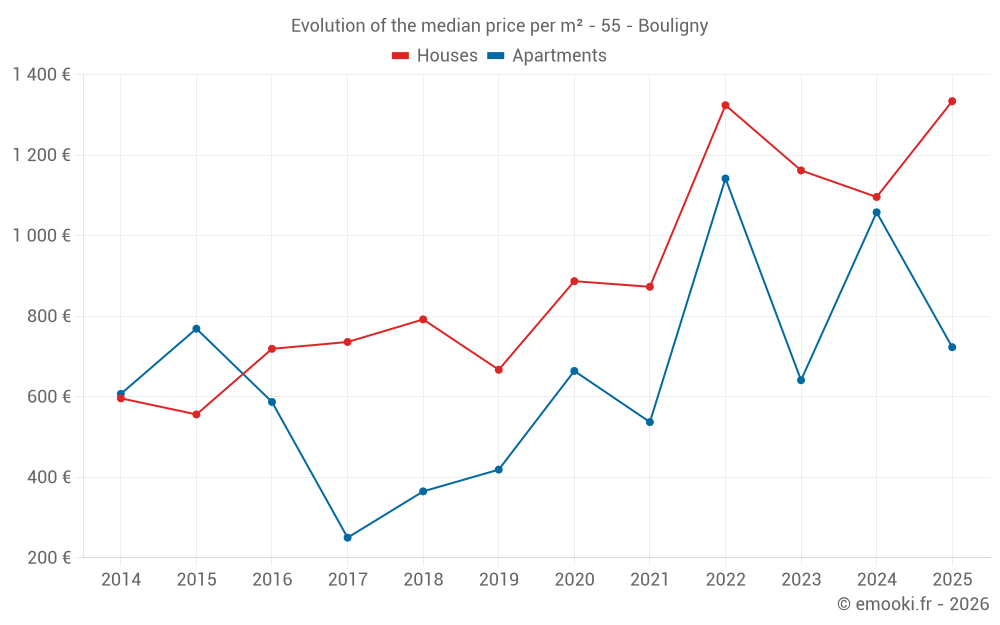
Median price of real estate
in the municipality of Bouligny

HousesHouses
1 232 € /m²
1-23-45-67-89-10
Reliability 8/10
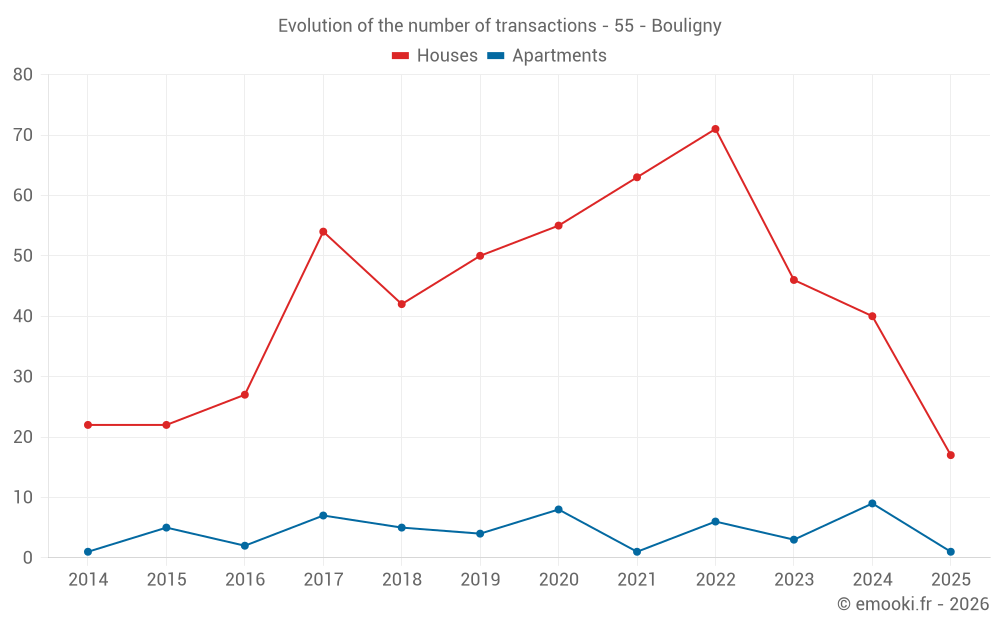
Median price on the 36 transactions of the last 12 months.
from 867 to
1 543 € /m²
60% of transactions from the 2nd to the 8th deciles.
ApartmentsApartments
953 € /m²
1-23-45-67-89-10
Reliability 6/10
Median price on the 14 transactions of the last 36 months.
from 628 to
1 210 € /m²
60% of transactions from the 2nd to the 8th deciles.
DwellingsDwellings
1 291 € /m²
1-23-45-67-89-10
Reliability 9/10
Median price on the 18 transactions of the last 6 months.
from 779 to
1 670 € /m²
60% of transactions from the 2nd to the 8th deciles.
HousesEvolution of the price per m² of houses since...
1 year
+22%
2 years
+15%
3 years
+0.8%
4 years
+53%
5 years
+50%
6 years
+100%
7 years
+68%
8 years
+81%
9 years
+86%
10 years
+140%
11 years
+124%

Yearly evolution

Evolution of the median price per m²

Evolution of the number of transactions

Warning, last year incomplete. Projections made based on the proportions between semesters of the previous year at the departmental/national level and by type of property.

Yearly data

Descending order
Year
Houses
house
transactions
Houses
house
Price per m²
Apartments
apt.
transactions
Apartments
apt.
Price per m²
2025
17
1 334 €
1
723 €
2024
40
1 096 €
9
1 058 €
2023
46
1 162 €
3
641 €
2022
71
1 324 €
6
1 142 €
2021
63
873 €
1
537 €
2020
55
887 €
8
664 €
2019
50
667 €
4
419 €
2018
42
792 €
5
365 €
2017
54
736 €
7
250 €
2016
27
719 €
2
587 €
2015
22
556 €
5
769 €
2014
22
596 €
1
607 €

Analysis

Structure of prices per m²

Values of price percentiles per m² over the periods used for the estimated price of each type of property.

Structure of transaction amounts

Values of transaction amounts percentiles over the periods used for the estimated price of each type of property.

Transaction amounts and prices per m² by percentile

Ascending order
Percentile
Houses
house
Price per m²
Houses
house
Transaction amount
Apartments
apt.
Price per m²
Apartments
apt.
Transaction amount
10th percentile
646 €
52 500 €
376 €
41 320 €
20th percentile
867 €
60 000 €
628 €
53 000 €
30th percentile
992 €
75 025 €
670 €
68 500 €
40th percentile
1 096 €
90 000 €
764 €
83 800 €
50th percentile
1 232 €
110 K€
953 €
96 500 €
60th percentile
1 330 €
125 K€
1 042 €
103 K€
70th percentile
1 439 €
132 K€
1 111 €
110 K€
80th percentile
1 543 €
156 K€
1 210 €
114 K€
90th percentile
1 754 €
189 K€
1 394 €
118 K€

National and departmental comparison

Evolution of the median price per m² of houses

Evolution of the median price per m² of apartments

Quarterly evolution

Evolution of the median price per m²

Evolution of the number of transactions

Quarterly data

Descending order
Quarter
Houses
house
transactions
Houses
house
Price per m²
Apartments
apt.
transactions
Apartments
apt.
Price per m²
2025 Q2
10
1 395 €
1
723 €
2025 Q1
7
1 216 €
0
--- €
2024 Q4
11
1 096 €
3
980 €
2024 Q3
8
1 126 €
2
1 064 €
2024 Q2
12
1 077 €
2
722 €
2024 Q1
9
1 179 €
2
1 154 €
2023 Q4
5
1 744 €
0
--- €
2023 Q3
14
1 162 €
0
--- €
2023 Q2
13
1 188 €
2
601 €
2023 Q1
14
876 €
1
641 €
2022 Q4
18
976 €
0
--- €
2022 Q3
18
1 388 €
1
1 472 €
2022 Q2
15
1 196 €
2
883 €
2022 Q1
20
1 368 €
3
812 €
2021 Q4
9
1 116 €
0
--- €
2021 Q3
22
1 204 €
0
--- €
2021 Q2
18
674 €
1
537 €
2021 Q1
14
862 €
0
--- €
2020 Q4
17
975 €
6
664 €
2020 Q3
14
1 161 €
0
--- €
2020 Q2
8
804 €
0
--- €
2020 Q1
16
706 €
2
748 €
2019 Q4
12
731 €
0
--- €
2019 Q3
13
726 €
1
962 €
2019 Q2
15
607 €
2
419 €
2019 Q1
10
579 €
1
231 €
2018 Q4
20
770 €
2
566 €
2018 Q3
5
978 €
0
--- €
2018 Q2
7
384 €
1
1 406 €
2018 Q1
10
708 €
2
245 €
2017 Q4
14
734 €
2
366 €
2017 Q3
10
782 €
2
440 €
2017 Q2
16
744 €
2
105 €
2017 Q1
14
676 €
1
250 €
2016 Q4
5
719 €
0
--- €
2016 Q3
11
563 €
1
740 €
2016 Q2
5
678 €
0
--- €
2016 Q1
6
992 €
1
434 €
2015 Q4
6
556 €
1
603 €
2015 Q3
3
1 271 €
3
800 €
2015 Q2
8
490 €
1
29 €
2015 Q1
5
538 €
0
--- €
2014 Q4
5
633 €
0
--- €
2014 Q3
4
758 €
1
607 €
2014 Q2
6
644 €
0
--- €
2014 Q1
7
460 €
0
--- €

Overview of the latest real estate transactions

The following list is an anonymized overview of the latest transactions. For more details and to find all transactions, please use the map to view transactions by plot or the transaction search page for a search by criteria.

2025-06-17
156 000 €
1 248 € /m²(125 m²)
Sale
Houses
House
4 rooms
125 m2
1 outbuilding
Land
480 m2
-Sols
Land
99 m2
-Landes
Land
1535 m2
-Vergers
Land
8905 m2
-Taillis simples
Land
546 m2
-Sols
2025-05-23
50 000 €
862 € /m²(58 m²)
Sale
Houses
House
3 rooms
58 m2
1 outbuilding
Land
166 m2
-Sols
2025-05-20
104 500 €
1 608 € /m²(65 m²)
Sale
Houses
House
3 rooms
65 m2
1 outbuilding
Land
310 m2
-Sols
2025-05-13
33 160 €
Sale
Land
1658 m2
-Jardins
/Jardin potager
2025-05-07
20 000 €
233 € /m²(86 m²)
Sale
Houses
House
3 rooms
86 m2
Land
390 m2
-Sols
1 outbuilding
Land
20 m2
-Sols
2025-04-30
188 500 €
2 142 € /m²(88 m²)
Sale
Houses
House
5 rooms
88 m2
Land
646 m2
-Sols
Land
292 m2
-Terres
2025-04-23
90 000 €
1 000 € /m²(90 m²)
Sale
Houses
House
4 rooms
90 m2
Land
821 m2
-Sols
2025-04-18
83 050 €
1 483 € /m²(56 m²)
Sale
Houses
House
2 rooms
56 m2
Land
205 m2
-Sols
2025-04-11
276 650 €
1 456 € /m²(190 m²)
Sale
Houses
House
5 rooms
190 m2
Land
233 m2
-Sols
Land
190 m2
-Sols
Land
105 m2
-Sols
Land
65 m2
-Sols
2025-04-10
394 800 €
1 334 € /m²(296 m²)
Sale
Houses
House
9 rooms
296 m2
3 outbuildings
Land
650 m2
-Sols
Land
3115 m2
-Jardins
/Jardin potager
Land
2960 m2
-Jardins
/Jardin potager
2025-04-08
37 600 €
723 € /m²(52 m²)
Sale
1 outbuilding
Land
228 m2
-Sols
Apartments
Apartment
2 rooms
52 m2
2 outbuildings
2025-04-07
215 790 €
1 798 € /m²(120 m²)
Sale
Houses
House
7 rooms
120 m2
2 outbuildings
Land
368 m2
-Sols
Land
630 m2
-Jardins
/Jardin potager
Land
7 m2
-Sols
2025-04-01
2 500 €
Sale
1 outbuilding
Land
26 m2
-Sols
2025-03-24
40 000 €
Sale
Land
1680 m2
-Terres
2025-03-14
130 000 €
1 711 € /m²(76 m²)
Sale
Houses
House
4 rooms
76 m2
Land
250 m2
-Sols
2025-03-12
50 000 €
641 € /m²(78 m²)
Sale
Houses
House
3 rooms
78 m2
1 outbuilding
Land
360 m2
-Sols
2025-03-10
134 900 €
1 204 € /m²(112 m²)
Sale
Houses
House
6 rooms
112 m2
Land
350 m2
-Sols
2025-02-12
87 990 €
1 354 € /m²(65 m²)
Sale
Houses
House
3 rooms
65 m2
1 outbuilding
Land
320 m2
-Sols
2025-02-11
86 350 €
1 216 € /m²(71 m²)
Sale
Houses
House
3 rooms
71 m2
1 outbuilding
Land
495 m2
-Sols
2025-02-05
49 000 €
471 € /m²(104 m²)
Sale
Houses
House
3 rooms
55 m2
1 outbuilding
Land
239 m2
-Sols
Houses
House
2 rooms
49 m2
1 outbuilding
Land
360 m2
-Sols
Land
30 m2
-Sols
712 transactions listed in the municipality

Meuse (55)

Most expensive cities

City
name
Descending orderHouses
house
Price per m²
5 577 €
1 815 €
1 759 €
1 742 €
1 724 €
1 715 €
1 676 €
1 649 €
1 618 €
1 606 €
City
name
Descending orderApartments
apt.
Price per m²
2 375 €
2 000 €
1 684 €
1 444 €
1 280 €
1 264 €
1 212 €
1 205 €
1 192 €
1 183 €

Least expensive cities

City
name
Ascending orderHouses
house
Price per m²
130 €
150 €
160 €
212 €
250 €
268 €
272 €
287 €
287 €
304 €
City
name
Ascending orderApartments
apt.
Price per m²
1 €
86 €
106 €
119 €
132 €
133 €
144 €
149 €