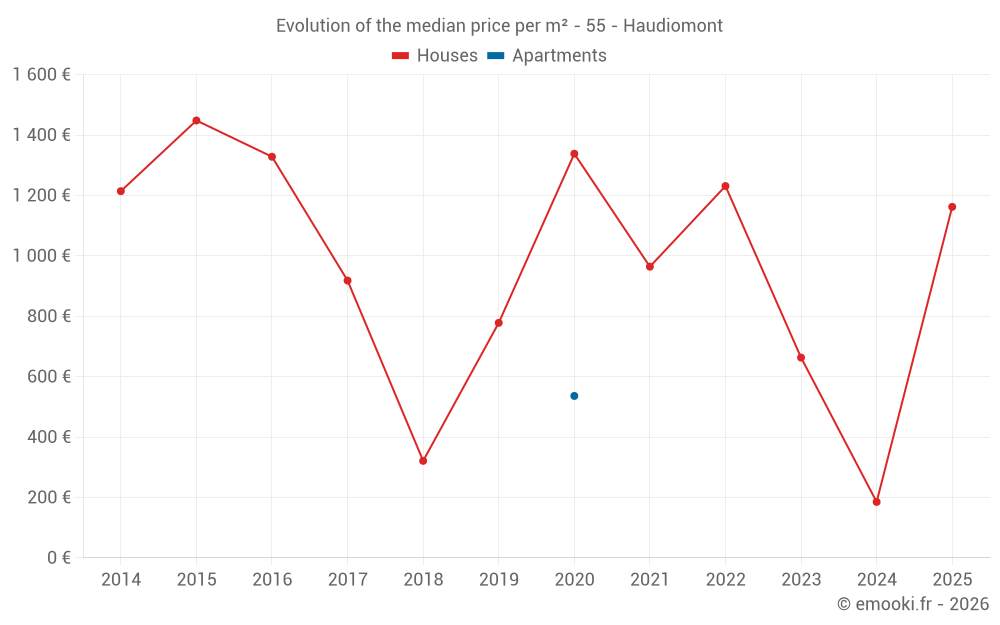
Median price of real estate
in the municipality of Haudiomont
Houses
1 231 € /m²
Reliability 4/10
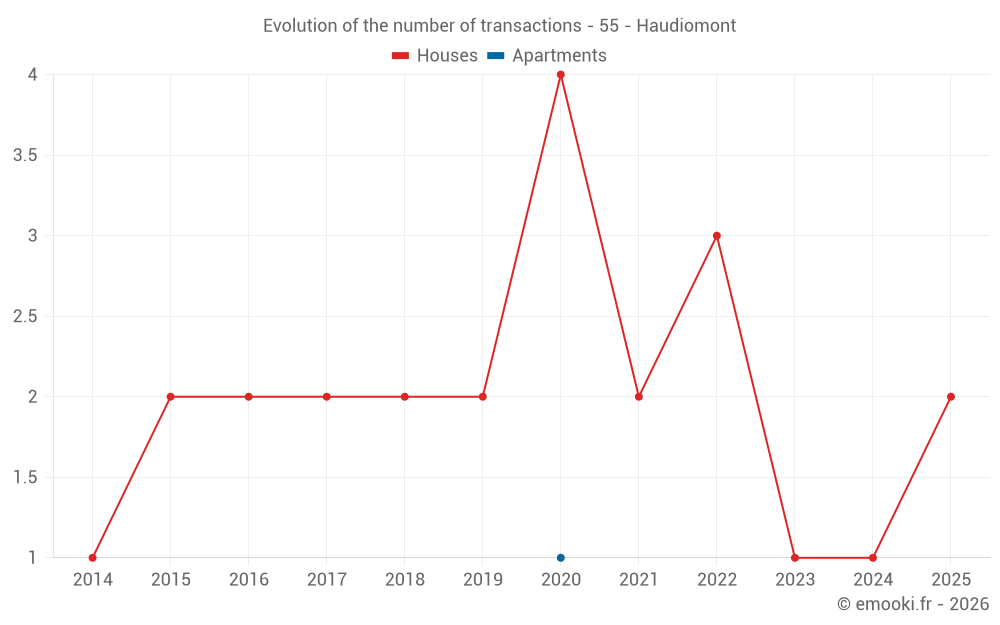
Median price on the 11 transactions of the last 60 months.
from 525 to
1 434 € /m²
1 434 € /m²
60% of transactions from the 2nd to the 8th deciles.
Apartments
536 € /m²
Reliability 1/10
Price of the unique transaction of the last 120 months.
Dwellings
1 231 € /m²
Reliability 4/10
Median price on the 11 transactions of the last 60 months.
from 525 to
1 434 € /m²
1 434 € /m²
60% of transactions from the 2nd to the 8th deciles.