emooki
HomePrice mapTransactions
🇬🇧 English🇫🇷 Français🇩🇪 Deutsch🇪🇸 Español🇮🇹 Italiano

Real estate price map


Real estate price map in the municipality of Verdun.

Meuse (55)
Verdun

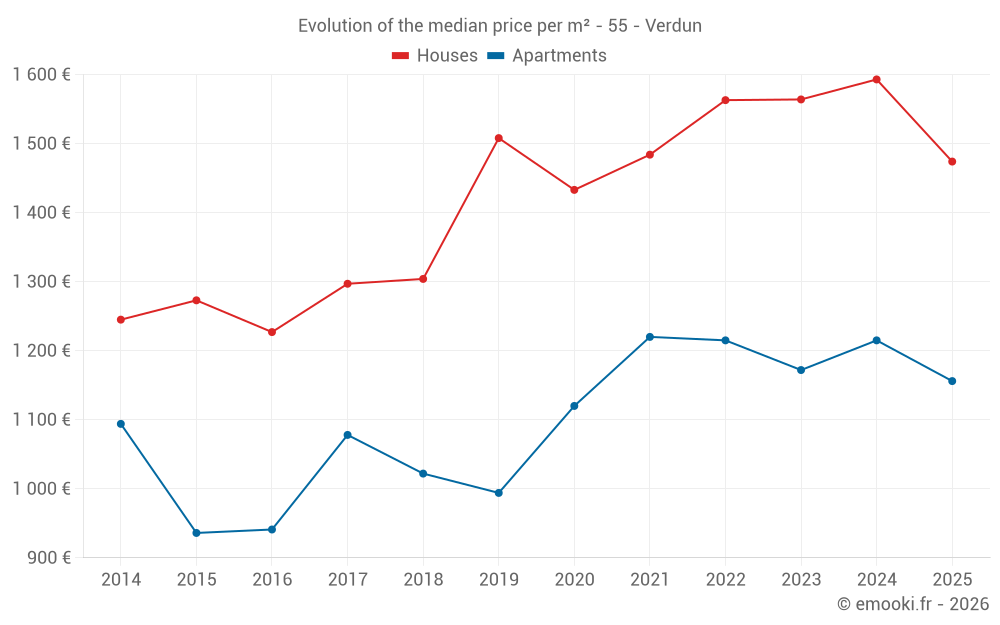
Median price of real estate
in the municipality of Verdun

HousesHouses
1 474 € /m²
1-23-45-67-89-10
Reliability 9/10
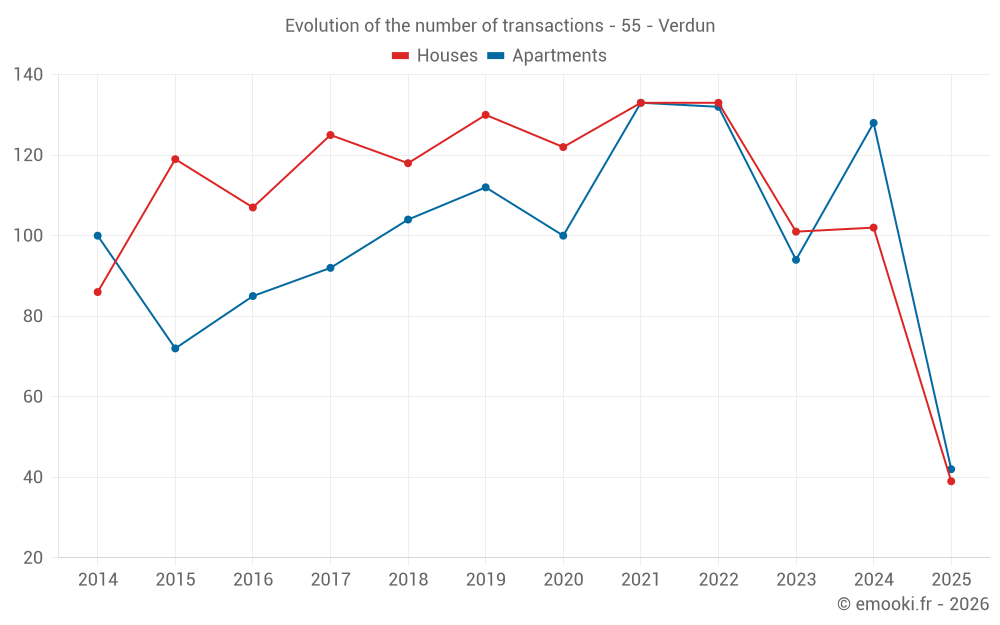
Median price on the 39 transactions of the last 6 months.
from 929 to
2 052 € /m²
60% of transactions from the 2nd to the 8th deciles.
ApartmentsApartments
1 156 € /m²
1-23-45-67-89-10
Reliability 9/10
Median price on the 42 transactions of the last 6 months.
from 776 to
1 482 € /m²
60% of transactions from the 2nd to the 8th deciles.
DwellingsDwellings
1 130 € /m²
1-23-45-67-89-10
Reliability 10/10
Median price on the 24 transactions of the last 3 months.
from 774 to
1 803 € /m²
60% of transactions from the 2nd to the 8th deciles.
HousesEvolution of the price per m² of houses since...
1 year
-7.5%
2 years
-5.8%
3 years
-5.7%
4 years
-0.7%
5 years
+2.9%
6 years
-2.3%
7 years
+13%
8 years
+14%
9 years
+20%
10 years
+16%
11 years
+18%
ApartmentsEvolution of the price per m² of apartments since...
1 year
-4.9%
2 years
-1.4%
3 years
-4.9%
4 years
-5.2%
5 years
+3.2%
6 years
+16%
7 years
+13%
8 years
+7.2%
9 years
+23%
10 years
+24%
11 years
+5.7%

Yearly evolution

Evolution of the median price per m²

Evolution of the number of transactions

Warning, last year incomplete. Projections made based on the proportions between semesters of the previous year at the departmental/national level and by type of property.

Yearly data

Descending order
Year
Houses
house
transactions
Houses
house
Price per m²
Apartments
apt.
transactions
Apartments
apt.
Price per m²
2025
39
1 474 €
42
1 156 €
2024
102
1 593 €
128
1 215 €
2023
101
1 564 €
94
1 172 €
2022
133
1 563 €
132
1 215 €
2021
133
1 484 €
133
1 220 €
2020
122
1 433 €
100
1 120 €
2019
130
1 508 €
112
994 €
2018
118
1 304 €
104
1 022 €
2017
125
1 297 €
92
1 078 €
2016
107
1 227 €
85
941 €
2015
119
1 273 €
72
936 €
2014
86
1 245 €
100
1 094 €

Analysis

Structure of prices per m²

Values of price percentiles per m² over the periods used for the estimated price of each type of property.

Structure of transaction amounts

Values of transaction amounts percentiles over the periods used for the estimated price of each type of property.

Transaction amounts and prices per m² by percentile

Ascending order
Percentile
Houses
house
Price per m²
Houses
house
Transaction amount
Apartments
apt.
Price per m²
Apartments
apt.
Transaction amount
10th percentile
776 €
77 700 €
718 €
45 300 €
20th percentile
929 €
96 600 €
776 €
58 768 €
30th percentile
1 083 €
112 K€
905 €
63 360 €
40th percentile
1 188 €
121 K€
1 110 €
65 640 €
50th percentile
1 474 €
143 K€
1 156 €
78 000 €
60th percentile
1 741 €
151 K€
1 248 €
91 000 €
70th percentile
1 856 €
173 K€
1 301 €
96 540 €
80th percentile
2 052 €
197 K€
1 482 €
127 K€
90th percentile
2 607 €
310 K€
1 611 €
157 K€

National and departmental comparison

Evolution of the median price per m² of houses

Evolution of the median price per m² of apartments

Quarterly evolution

Evolution of the median price per m²

Evolution of the number of transactions

Quarterly data

Descending order
Quarter
Houses
house
transactions
Houses
house
Price per m²
Apartments
apt.
transactions
Apartments
apt.
Price per m²
2025 Q2
13
1 071 €
11
1 158 €
2025 Q1
26
1 737 €
31
1 154 €
2024 Q4
35
1 688 €
34
1 166 €
2024 Q3
26
1 448 €
29
1 122 €
2024 Q2
18
1 658 €
35
1 454 €
2024 Q1
23
1 543 €
30
1 233 €
2023 Q4
32
1 718 €
25
1 173 €
2023 Q3
25
1 655 €
20
1 172 €
2023 Q2
25
1 564 €
27
1 160 €
2023 Q1
19
1 216 €
22
1 264 €
2022 Q4
36
1 704 €
32
1 424 €
2022 Q3
40
1 670 €
38
1 204 €
2022 Q2
35
1 436 €
32
1 164 €
2022 Q1
22
1 402 €
30
1 230 €
2021 Q4
35
1 481 €
30
1 310 €
2021 Q3
38
1 483 €
34
1 206 €
2021 Q2
30
1 556 €
39
1 145 €
2021 Q1
30
1 273 €
30
1 168 €
2020 Q4
41
1 367 €
32
1 250 €
2020 Q3
34
1 452 €
15
982 €
2020 Q2
25
1 533 €
26
1 106 €
2020 Q1
22
1 498 €
27
1 143 €
2019 Q4
36
1 544 €
23
1 019 €
2019 Q3
39
1 543 €
32
872 €
2019 Q2
28
1 364 €
30
1 226 €
2019 Q1
27
1 385 €
27
938 €
2018 Q4
33
1 370 €
24
943 €
2018 Q3
28
1 406 €
31
1 088 €
2018 Q2
33
1 238 €
25
1 019 €
2018 Q1
24
1 278 €
24
1 024 €
2017 Q4
25
1 354 €
22
1 162 €
2017 Q3
42
1 364 €
21
1 033 €
2017 Q2
33
1 221 €
31
1 105 €
2017 Q1
25
1 235 €
18
940 €
2016 Q4
22
1 256 €
20
861 €
2016 Q3
34
1 354 €
18
983 €
2016 Q2
27
1 103 €
24
1 027 €
2016 Q1
24
1 222 €
23
962 €
2015 Q4
35
1 297 €
15
897 €
2015 Q3
32
1 290 €
25
909 €
2015 Q2
36
1 167 €
13
939 €
2015 Q1
16
1 172 €
19
1 071 €
2014 Q4
22
1 252 €
20
990 €
2014 Q3
25
1 346 €
35
1 153 €
2014 Q2
24
1 302 €
18
1 108 €
2014 Q1
15
913 €
27
1 106 €

Meuse (55)

Most expensive cities

City
name
Descending orderHouses
house
Price per m²
5 577 €
1 815 €
1 759 €
1 742 €
1 724 €
1 715 €
1 676 €
1 649 €
1 618 €
1 606 €
City
name
Descending orderApartments
apt.
Price per m²
2 375 €
2 000 €
1 684 €
1 444 €
1 280 €
1 264 €
1 212 €
1 205 €
1 192 €
1 183 €

Least expensive cities

City
name
Ascending orderHouses
house
Price per m²
130 €
150 €
160 €
212 €
250 €
268 €
272 €
287 €
287 €
304 €
City
name
Ascending orderApartments
apt.
Price per m²
1 €
86 €
106 €
119 €
132 €
133 €
144 €
149 €