emooki
HomePrice mapTransactions
🇬🇧 English🇫🇷 Français🇩🇪 Deutsch🇪🇸 Español🇮🇹 Italiano

Real estate price map


Real estate price map in the municipality of Tréveray, choose a section to see transactions by parcel.

Meuse (55)
Tréveray

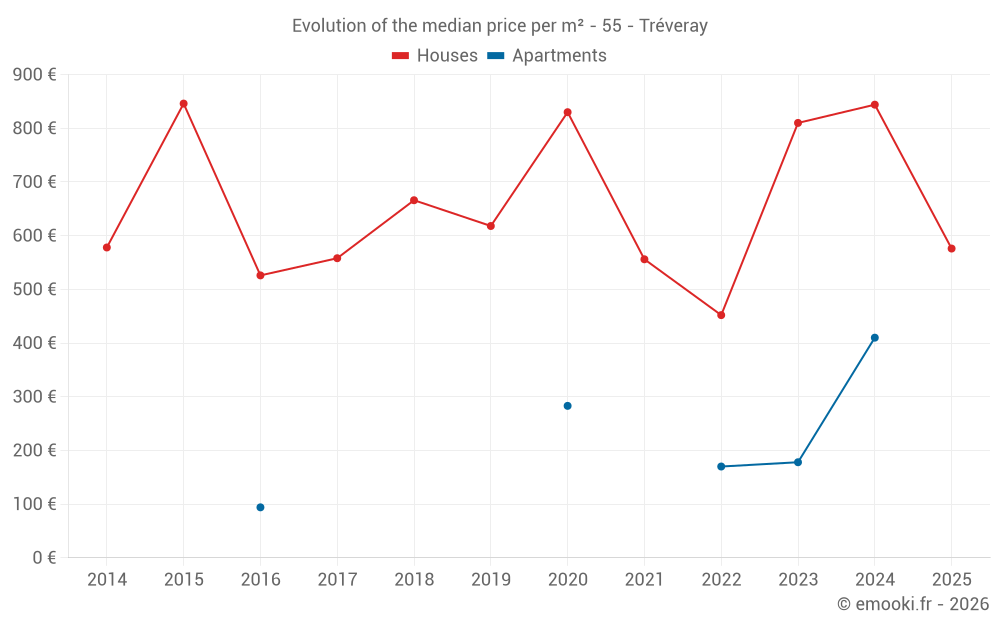
Median price of real estate
in the municipality of Tréveray

HousesHouses
766  /m²
1-23-45-67-89-10
Reliability 7/10
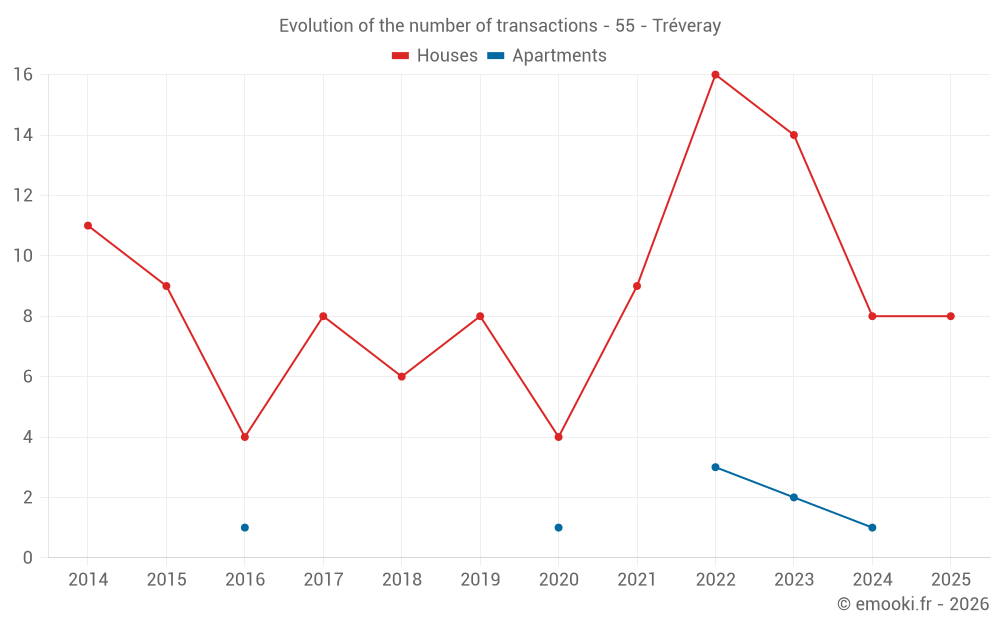
Median price on the 26 transactions of the last 24 months.
from 363 to
1 154  /m²
60% of transactions from the 2nd to the 8th deciles.
ApartmentsApartments
208  /m²
1-23-45-67-89-10
Reliability 3/10
Median price on the 7 transactions of the last 72 months.
DwellingsDwellings
712  /m²
1-23-45-67-89-10
Reliability 7/10
Median price on the 28 transactions of the last 24 months.
from 353 to
1 115  /m²
60% of transactions from the 2nd to the 8th deciles.
HousesEvolution of the price per m² of houses since...
1 year
-32%
2 years
-29%
3 years
+27%
4 years
+3.6%
5 years
-31%
6 years
-6.8%
7 years
-14%
8 years
+3.2%
9 years
+10%
10 years
-32%
11 years
-0.3%
The price per m² of houses has increased by 27% since 3 years, but it has decreased by 32% in 10 years.

Yearly evolution

Evolution of the median price per m²

Evolution of the number of transactions

Warning, last year incomplete. Projections made based on the proportions between semesters of the previous year at the departmental/national level and by type of property.

Yearly data

Descending order
Year
Houses
house
transactions
Houses
house
Price per m²
Apartments
apt.
transactions
Apartments
apt.
Price per m²
2025
8
576 
0
--- 
2024
8
844 
1
410 
2023
14
810 
2
178 
2022
16
452 
3
170 
2021
9
556 
0
--- 
2020
4
830 
1
283 
2019
8
618 
0
--- 
2018
6
666 
0
--- 
2017
8
558 
0
--- 
2016
4
526 
1
94 
2015
9
846 
0
--- 
2014
11
578 
0
--- 

Analysis

Structure of prices per m²

Values of price percentiles per m² over the periods used for the estimated price of each type of property.

Structure of transaction amounts

Values of transaction amounts percentiles over the periods used for the estimated price of each type of property.

Transaction amounts and prices per m² by percentile

Ascending order
Percentile
Houses
house
Price per m²
Houses
house
Transaction amount
Apartments
apt.
Price per m²
Apartments
apt.
Transaction amount
10th percentile
299 
21 250 
129 
10 200 
20th percentile
363 
33 000 
152 
11 800 
30th percentile
422 
44 750 
165 
14 200 
40th percentile
683 
56 000 
185 
16 400 
50th percentile
766 
81 800 
208 
18 500 
60th percentile
882 
87 400 
253 
33 200 
70th percentile
947 
98 800 
291 
43 400 
80th percentile
1 154 
105 K
314 
44 600 
90th percentile
1 272 
152 K
357 
49 800 

National and departmental comparison

Evolution of the median price per m² of houses

Evolution of the median price per m² of apartments

Quarterly evolution

Evolution of the median price per m²

Evolution of the number of transactions

Quarterly data

Descending order
Quarter
Houses
house
transactions
Houses
house
Price per m²
Apartments
apt.
transactions
Apartments
apt.
Price per m²
2025 Q1
8
576 
0
--- 
2024 Q4
2
342 
1
410 
2024 Q3
1
1 154 
0
--- 
2024 Q2
3
1 056 
0
--- 
2024 Q1
2
785 
0
--- 
2023 Q4
4
964 
1
147 
2023 Q3
6
696 
0
--- 
2023 Q2
4
1 058 
1
208 
2022 Q4
2
884 
0
--- 
2022 Q3
4
174 
0
--- 
2022 Q2
5
511 
2
136 
2022 Q1
5
603 
1
322 
2021 Q3
1
533 
0
--- 
2021 Q2
5
543 
0
--- 
2021 Q1
3
1 327 
0
--- 
2020 Q4
1
953 
0
--- 
2020 Q3
2
781 
0
--- 
2020 Q2
1
708 
0
--- 
2020 Q1
0
--- 
1
283 
2019 Q4
2
802 
0
--- 
2019 Q3
3
612 
0
--- 
2019 Q2
1
325 
0
--- 
2019 Q1
2
686 
0
--- 
2018 Q4
3
641 
0
--- 
2018 Q3
1
911 
0
--- 
2018 Q1
2
600 
0
--- 
2017 Q4
2
558 
0
--- 
2017 Q3
1
247 
0
--- 
2017 Q2
3
431 
0
--- 
2017 Q1
2
906 
0
--- 
2016 Q3
2
277 
0
--- 
2016 Q2
1
756 
0
--- 
2016 Q1
1
536 
1
94 
2015 Q4
5
231 
0
--- 
2015 Q2
1
1 122 
0
--- 
2015 Q1
3
1 050 
0
--- 
2014 Q4
3
769 
0
--- 
2014 Q3
2
464 
0
--- 
2014 Q2
3
395 
0
--- 
2014 Q1
3
578 
0
--- 

Overview of the latest real estate transactions

The following list is an anonymized overview of the latest transactions. For more details and to find all transactions, please use the map to view transactions by plot or the transaction search page for a search by criteria.

2025-05-14
55 000 
Sale
Land
13357 m2
-Bois
Land
2887 m2
-Taillis sous futaie
Land
4881 m2
-Taillis simples
Land
4881 m2
-Bois
Land
13357 m2
-Futaies résineuses
Land
2887 m2
-Bois
Land
10910 m2
-Bois
Land
10910 m2
-Futaies résineuses
Land
400 m2
-Taillis sous futaie
Land
400 m2
-Bois
Land
31135 m2
-Futaies résineuses
Land
31135 m2
-Bois
Land
210 m2
-Taillis sous futaie
Land
210 m2
-Bois
Land
1660 m2
-Bois
Land
850 m2
-Futaies résineuses
Land
850 m2
-Bois
Land
1520 m2
-Terres
Land
1660 m2
-Taillis sous futaie
Land
2190 m2
-Bois
Land
625 m2
-Bois
Land
625 m2
-Taillis sous futaie
Land
2190 m2
-Futaies résineuses
2025-03-26
25 000 
347  /m²(72 m²)
Sale
Houses
House
3 rooms
72 m2
Land
122 m2
-Sols
Land
105 m2
-Sols
Land
83 m2
-Sols
Land
36 m2
-Sols
Land
358 m2
-Jardins
/Jardin potager
Land
50 m2
-Sols
2025-03-20
22 500 
363  /m²(62 m²)
Sale
Houses
House
3 rooms
62 m2
Land
265 m2
-Sols
2025-03-20
3 000 
70  /m²(43 m²)
Sale
Houses
House
1 room
43 m2
Land
235 m2
-Sols
2025-02-21
81 600 
983  /m²(83 m²)
Sale
Houses
House
4 rooms
83 m2
Land
623 m2
-Sols
1 outbuilding
Land
297 m2
-Sols
2025-01-27
85 000 
457  /m²(186 m²)
Sale
Houses
House
7 rooms
186 m2
1 outbuilding
Land
1206 m2
-Jardins
/Jardin potager
Land
576 m2
-Sols
2025-01-24
82 000 
882  /m²(93 m²)
Sale
Houses
House
5 rooms
93 m2
Land
1066 m2
-Sols
2025-01-17
164 000 
1 224  /m²(134 m²)
Sale
Houses
House
5 rooms
134 m2
Land
487 m2
-Jardins
/Jardin potager
Land
480 m2
-Jardins
/Jardin potager
2025-01-17
44 500 
695  /m²(64 m²)
Sale
Houses
House
3 rooms
64 m2
Land
553 m2
-Sols
2025-01-09
45 000 
Sale
Land
537 m2
-Sols
Land
583 m2
-Jardins
/Jardin potager
Land
199 m2
-Sols
Land
92 m2
-Jardins
/Jardin potager
2024-12-06
33 000 
300  /m²(110 m²)
Sale
Houses
House
5 rooms
110 m2
Land
352 m2
-Sols
1 outbuilding
Land
70 m2
-Sols
Land
20 m2
-Sols
2024-11-22
43 000 
410  /m²(105 m²)
Sale
Apartments
Apartment
4 rooms
75 m2
Apartments
Apartment
1 room
30 m2
3 outbuildings
Land
530 m2
-Sols
2024-11-21
4 000 
Sale
2 outbuildings
Land
190 m2
-Sols
2024-10-23
200 
Sale
Land
230 m2
-Vergers
2024-10-09
20 000 
385  /m²(52 m²)
Sale
Houses
House
2 rooms
52 m2
1 outbuilding
Land
543 m2
-Sols
2024-08-26
1 200 
Sale
Land
296 m2
-Jardins
/Jardin potager
2024-08-02
94 600 
1 154  /m²(82 m²)
Sale
Houses
House
4 rooms
82 m2
Land
396 m2
-Sols
2024-06-13
500 
Sale
Land
1210 m2
-Bois
Land
1210 m2
-Taillis simples
Land
1711 m2
-Taillis simples
Land
1710 m2
-Bois
Land
1418 m2
-Taillis simples
Land
1418 m2
-Bois
Land
710 m2
-Landes
/Friche
2024-05-15
135 000 
1 517  /m²(89 m²)
Sale
Land
202 m2
-Sols
Houses
House
4 rooms
89 m2
Land
394 m2
-Sols
Land
404 m2
-Jardins
/Jardin potager
Land
14 m2
-Sols
Land
27 m2
-Sols
Land
1783 m2
-Prés
2024-05-13
65 000 
802  /m²(81 m²)
Sale
Houses
House
4 rooms
81 m2
Land
568 m2
-Sols
196 transactions listed in the municipality

Meuse (55)

Most expensive cities

City
name
Descending orderHouses
house
Price per m²
5 577 
1 815 
1 742 
1 715 
1 676 
1 649 
1 618 
1 606 
City
name
Descending orderApartments
apt.
Price per m²
2 375 
2 000 
1 684 
1 280 
1 264 
1 205 
1 192 
1 183 

Least expensive cities

City
name
Ascending orderHouses
house
Price per m²
150 
212 
268 
272 
287 
287 
City
name
Ascending orderApartments
apt.
Price per m²
1 
133 
149