emooki
HomePrice mapTransactions
🇬🇧 English🇫🇷 Français🇩🇪 Deutsch🇪🇸 Español🇮🇹 Italiano

Real estate price map


Real estate price map in the municipality of Trémont-sur-Saulx.

Meuse (55)
Trémont-sur-Saulx

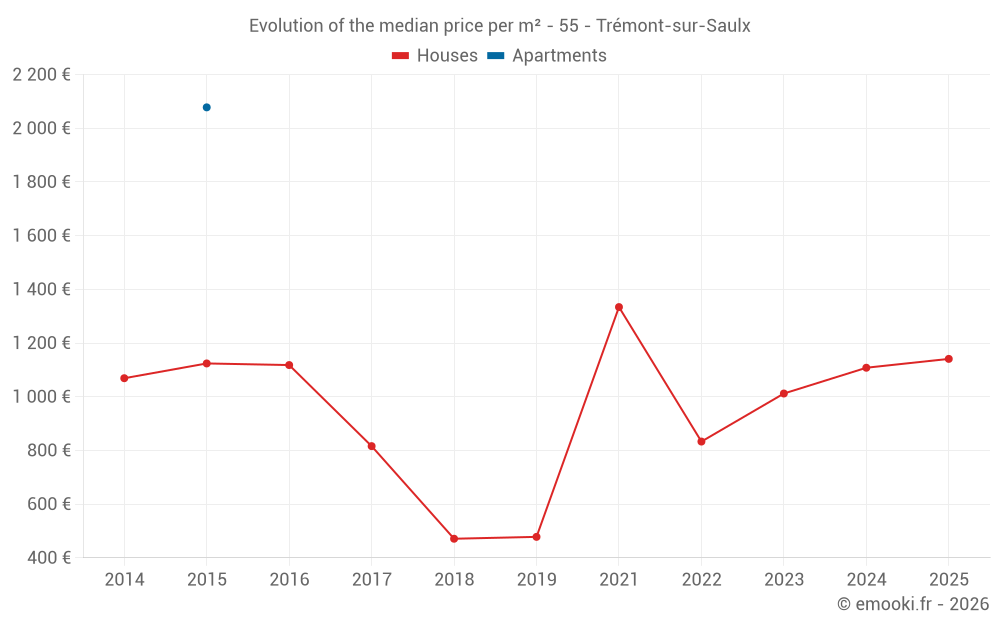
Median price of real estate
in the municipality of Trémont-sur-Saulx

HousesHouses
1 012  /m²
1-23-45-67-89-10
Reliability 6/10
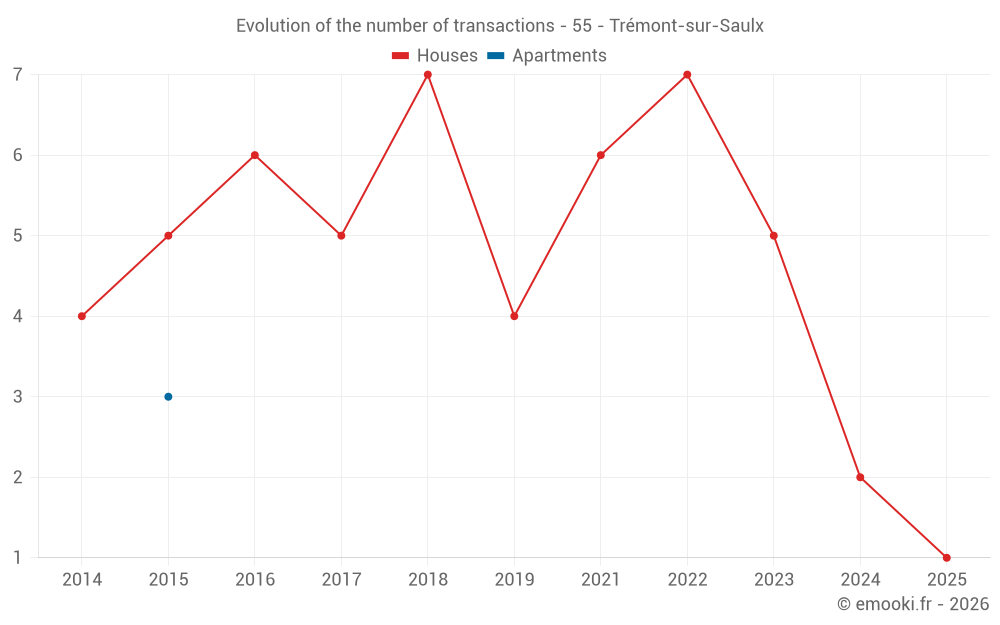
Median price on the 13 transactions of the last 36 months.
from 772 to
1 408  /m²
60% of transactions from the 2nd to the 8th deciles.
HousesEvolution of the price per m² of houses since...
1 year
--
2 years
--
3 years
--
4 years
--
5 years
--
6 years
--
7 years
--
8 years
--
9 years
--
10 years
--
11 years
--
ApartmentsEvolution of the price per m² of apartments since...
1 year
--
2 years
--
3 years
--
4 years
--
5 years
--
6 years
--
7 years
--
8 years
--
9 years
--
10 years
--
11 years
--

Yearly evolution

Evolution of the median price per m²

Evolution of the number of transactions

Warning, last year incomplete. Projections made based on the proportions between semesters of the previous year at the departmental/national level and by type of property.

Yearly data

Descending order
Year
Houses
house
transactions
Houses
house
Price per m²
Apartments
apt.
transactions
Apartments
apt.
Price per m²
2025
1
1 141 
0
--- 
2024
2
1 108 
0
--- 
2023
5
1 012 
0
--- 
2022
7
833 
0
--- 
2021
6
1 334 
0
--- 
2020
0
--- 
0
--- 
2019
4
478 
0
--- 
2018
7
471 
0
--- 
2017
5
816 
0
--- 
2016
6
1 118 
0
--- 
2015
5
1 124 
3
2 078 
2014
4
1 069 
0
--- 

Analysis

Structure of prices per m²

Values of price percentiles per m² over the periods used for the estimated price of each type of property.

Structure of transaction amounts

Values of transaction amounts percentiles over the periods used for the estimated price of each type of property.

Transaction amounts and prices per m² by percentile

Ascending order
Percentile
Houses
house
Price per m²
Houses
house
Transaction amount
Apartments
apt.
Price per m²
Apartments
apt.
Transaction amount
10th percentile
763 
77 000 
--- 
--- 
20th percentile
772 
85 000 
--- 
--- 
30th percentile
813 
96 640 
--- 
--- 
40th percentile
833 
124 K
--- 
--- 
50th percentile
1 012 
140 K
--- 
--- 
60th percentile
1 162 
153 K
--- 
--- 
70th percentile
1 284 
168 K
--- 
--- 
80th percentile
1 408 
176 K
--- 
--- 
90th percentile
1 513 
220 K
--- 
--- 

National and departmental comparison

Evolution of the median price per m² of houses

Evolution of the median price per m² of apartments

Quarterly evolution

Evolution of the median price per m²

Evolution of the number of transactions

Quarterly data

Descending order
Quarter
Houses
house
transactions
Houses
house
Price per m²
Apartments
apt.
transactions
Apartments
apt.
Price per m²
2025 Q1
1
1 141 
0
--- 
2024 Q4
1
1 455 
0
--- 
2024 Q1
1
762 
0
--- 
2023 Q4
1
1 563 
0
--- 
2023 Q2
2
1 180 
0
--- 
2023 Q1
2
897 
0
--- 
2022 Q4
2
1 085 
0
--- 
2022 Q3
3
765 
0
--- 
2022 Q1
2
1 096 
0
--- 
2021 Q4
1
1 330 
0
--- 
2021 Q2
4
1 066 
0
--- 
2021 Q1
1
1 641 
0
--- 
2019 Q4
3
527 
0
--- 
2019 Q3
1
429 
0
--- 
2018 Q4
3
471 
0
--- 
2018 Q3
1
740 
0
--- 
2018 Q1
3
457 
0
--- 
2017 Q3
1
816 
0
--- 
2017 Q2
3
885 
0
--- 
2017 Q1
1
699 
0
--- 
2016 Q4
1
575 
0
--- 
2016 Q3
2
1 448 
0
--- 
2016 Q2
1
500 
0
--- 
2016 Q1
2
1 118 
0
--- 
2015 Q4
1
158 
0
--- 
2015 Q3
4
1 230 
0
--- 
2015 Q2
0
--- 
3
2 078 
2014 Q4
1
802 
0
--- 
2014 Q3
1
1 269 
0
--- 
2014 Q1
2
1 069 
0
--- 

Meuse (55)

Most expensive cities

City
name
Descending orderHouses
house
Price per m²
5 577 
1 815 
1 742 
1 715 
1 676 
1 649 
1 618 
1 606 
City
name
Descending orderApartments
apt.
Price per m²
2 375 
2 000 
1 684 
1 280 
1 264 
1 205 
1 192 
1 183 

Least expensive cities

City
name
Ascending orderHouses
house
Price per m²
150 
212 
268 
272 
287 
287 
City
name
Ascending orderApartments
apt.
Price per m²
1 
133 
149