emooki
HomePrice mapTransactions
🇬🇧 English🇫🇷 Français🇩🇪 Deutsch🇪🇸 Español🇮🇹 Italiano

Real estate price map


Real estate price map in the municipality of Saint-Mihiel.

Meuse (55)
Saint-Mihiel

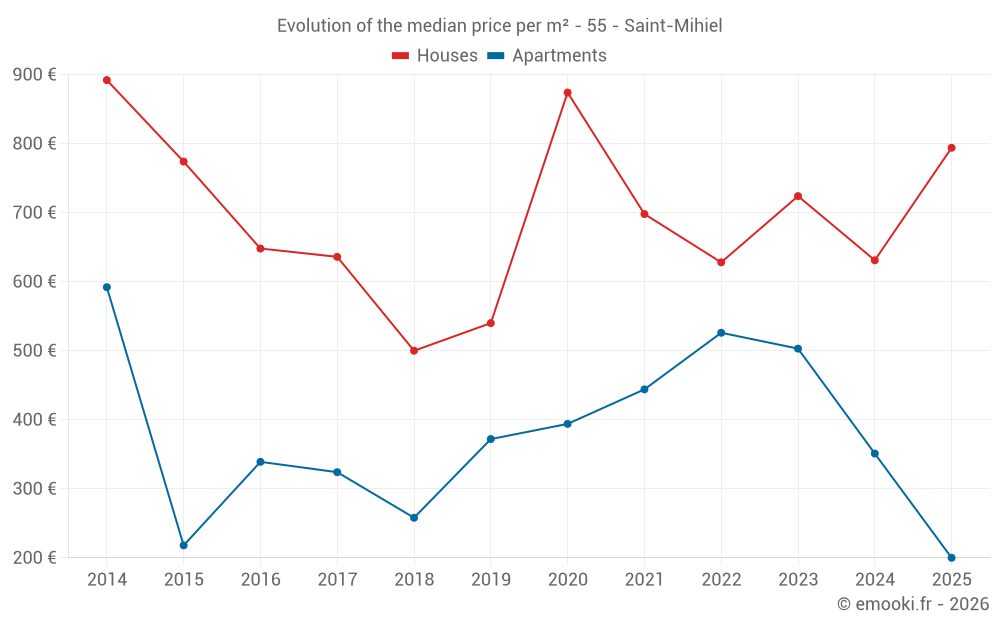
Median price of real estate
in the municipality of Saint-Mihiel

HousesHouses
650 € /m²
1-23-45-67-89-10
Reliability 8/10
Median price on the 27 transactions of the last 12 months.
from 345 to
867 € /m²
60% of transactions from the 2nd to the 8th deciles.
ApartmentsApartments
351 € /m²
1-23-45-67-89-10
Reliability 7/10
Median price on the 19 transactions of the last 24 months.
from 181 to
553 € /m²
60% of transactions from the 2nd to the 8th deciles.
DwellingsDwellings
584 € /m²
1-23-45-67-89-10
Reliability 8/10
Median price on the 33 transactions of the last 12 months.
from 281 to
829 € /m²
60% of transactions from the 2nd to the 8th deciles.
HousesEvolution of the price per m² of houses since...
1 year
+26%
2 years
+10%
3 years
+26%
4 years
+14%
5 years
-9.2%
6 years
+47%
7 years
+59%
8 years
+25%
9 years
+23%
10 years
+2.6%
11 years
-11%
ApartmentsEvolution of the price per m² of apartments since...
1 year
--
2 years
--
3 years
--
4 years
--
5 years
--
6 years
--
7 years
--
8 years
--
9 years
--
10 years
--
11 years
--

Yearly evolution

Evolution of the median price per m²

Evolution of the number of transactions

Warning, last year incomplete. Projections made based on the proportions between semesters of the previous year at the departmental/national level and by type of property.

Yearly data

Descending order
Year
Houses
house
transactions
Houses
house
Price per m²
Apartments
apt.
transactions
Apartments
apt.
Price per m²
2025
10
794 €
3
200 €
2024
36
631 €
11
351 €
2023
38
724 €
9
503 €
2022
43
628 €
16
526 €
2021
49
698 €
18
444 €
2020
43
874 €
12
394 €
2019
38
540 €
13
372 €
2018
36
500 €
5
258 €
2017
35
636 €
8
324 €
2016
34
648 €
8
339 €
2015
20
774 €
10
218 €
2014
29
892 €
6
592 €

Analysis

Structure of prices per m²

Values of price percentiles per m² over the periods used for the estimated price of each type of property.

Structure of transaction amounts

Values of transaction amounts percentiles over the periods used for the estimated price of each type of property.

Transaction amounts and prices per m² by percentile

Ascending order
Percentile
Houses
house
Price per m²
Houses
house
Transaction amount
Apartments
apt.
Price per m²
Apartments
apt.
Transaction amount
10th percentile
275 €
25 000 €
93 €
13 800 €
20th percentile
345 €
30 000 €
181 €
18 600 €
30th percentile
406 €
37 800 €
257 €
23 200 €
40th percentile
538 €
56 450 €
306 €
38 600 €
50th percentile
650 €
65 250 €
351 €
45 000 €
60th percentile
703 €
96 300 €
383 €
58 000 €
70th percentile
805 €
116 K€
485 €
87 500 €
80th percentile
867 €
121 K€
553 €
101 K€
90th percentile
1 235 €
132 K€
671 €
124 K€

National and departmental comparison

Evolution of the median price per m² of houses

Evolution of the median price per m² of apartments

Quarterly evolution

Evolution of the median price per m²

Evolution of the number of transactions

Quarterly data

Descending order
Quarter
Houses
house
transactions
Houses
house
Price per m²
Apartments
apt.
transactions
Apartments
apt.
Price per m²
2025 Q2
7
771 €
1
611 €
2025 Q1
3
816 €
2
176 €
2024 Q4
9
695 €
2
193 €
2024 Q3
8
504 €
1
515 €
2024 Q2
15
407 €
5
373 €
2024 Q1
4
1 332 €
3
21 €
2023 Q4
10
847 €
1
652 €
2023 Q3
8
492 €
4
404 €
2023 Q2
11
487 €
1
474 €
2023 Q1
9
880 €
3
556 €
2022 Q4
8
817 €
6
585 €
2022 Q3
11
580 €
2
424 €
2022 Q2
15
502 €
4
564 €
2022 Q1
9
563 €
4
276 €
2021 Q4
14
686 €
5
647 €
2021 Q3
13
765 €
7
300 €
2021 Q2
14
572 €
3
306 €
2021 Q1
8
796 €
3
484 €
2020 Q4
13
614 €
5
485 €
2020 Q3
11
874 €
2
128 €
2020 Q2
10
1 112 €
1
534 €
2020 Q1
9
963 €
4
360 €
2019 Q4
15
427 €
1
380 €
2019 Q3
7
250 €
4
406 €
2019 Q2
4
502 €
5
278 €
2019 Q1
12
822 €
3
571 €
2018 Q4
14
728 €
2
546 €
2018 Q3
10
517 €
2
344 €
2018 Q2
5
490 €
1
116 €
2018 Q1
7
429 €
0
--- €
2017 Q4
8
328 €
2
540 €
2017 Q3
9
775 €
0
--- €
2017 Q2
7
886 €
2
224 €
2017 Q1
11
612 €
4
266 €
2016 Q4
6
580 €
3
247 €
2016 Q3
10
884 €
0
--- €
2016 Q2
10
336 €
3
387 €
2016 Q1
8
736 €
2
500 €
2015 Q4
8
668 €
3
136 €
2015 Q3
8
1 058 €
3
241 €
2015 Q2
3
524 €
1
446 €
2015 Q1
1
276 €
3
392 €
2014 Q4
10
910 €
5
521 €
2014 Q3
12
617 €
1
753 €
2014 Q2
1
1 246 €
0
--- €
2014 Q1
6
944 €
0
--- €

Meuse (55)

Most expensive cities

City
name
Descending orderHouses
house
Price per m²
5 577 €
1 815 €
1 759 €
1 742 €
1 724 €
1 715 €
1 676 €
1 649 €
1 618 €
1 606 €
City
name
Descending orderApartments
apt.
Price per m²
2 375 €
2 000 €
1 684 €
1 444 €
1 280 €
1 264 €
1 212 €
1 205 €
1 192 €
1 183 €

Least expensive cities

City
name
Ascending orderHouses
house
Price per m²
130 €
150 €
160 €
212 €
250 €
268 €
272 €
287 €
287 €
304 €
City
name
Ascending orderApartments
apt.
Price per m²
1 €
86 €
106 €
119 €
132 €
133 €
144 €
149 €