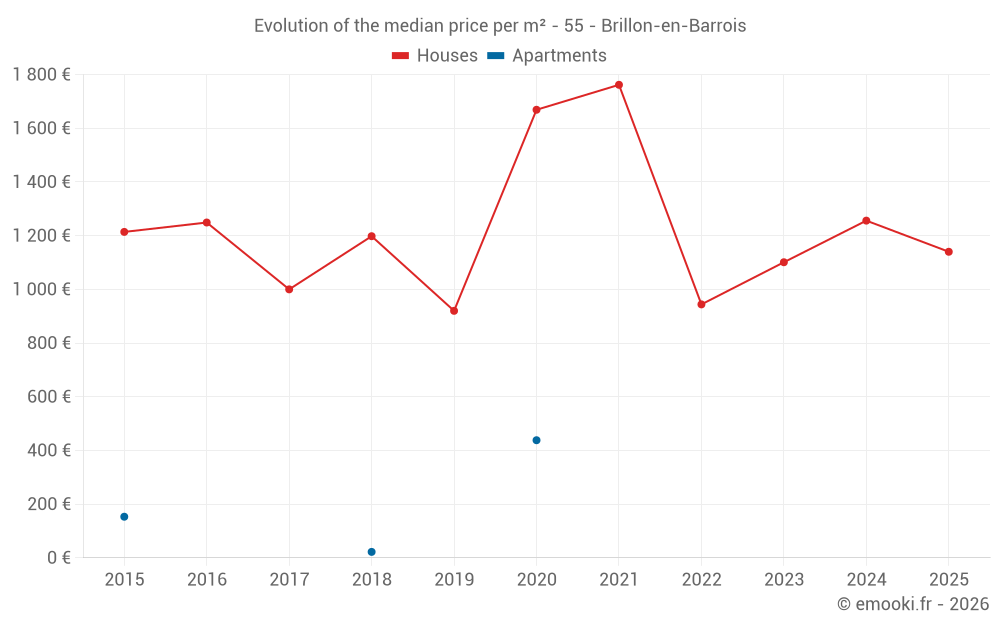
Median price of real estate
in the municipality of Brillon-en-Barrois
Houses
1 082 € /m²
Reliability 6/10
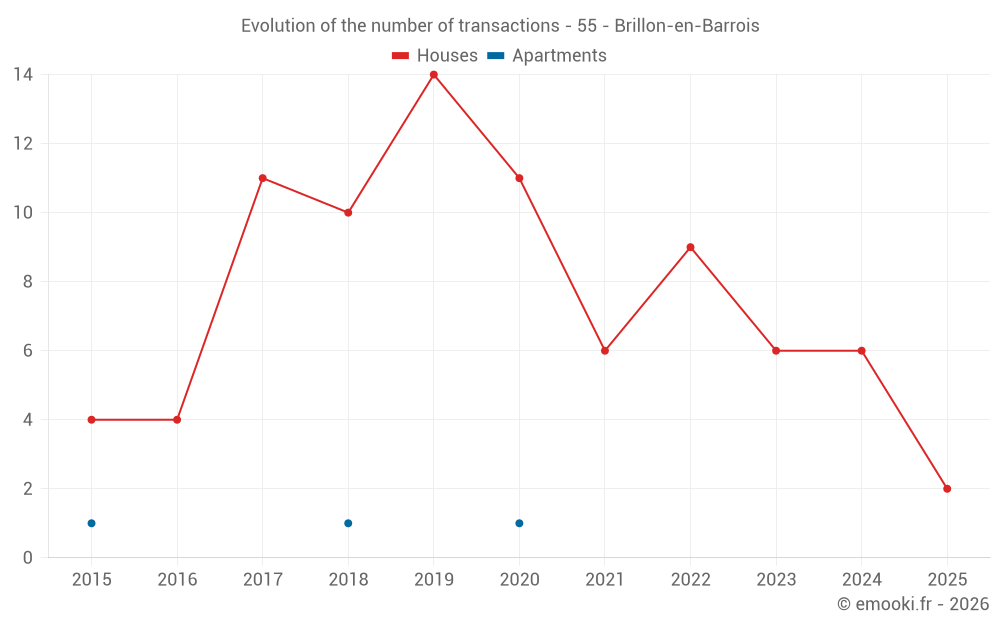
Median price on the 19 transactions of the last 36 months.
from 881 to
1 448 € /m²
1 448 € /m²
60% of transactions from the 2nd to the 8th deciles.
Apartments
153 € /m²
Reliability 1/10
Median price on the 3 transactions of the last 120 months.
Dwellings
1 082 € /m²
Reliability 6/10
Median price on the 19 transactions of the last 36 months.
from 881 to
1 448 € /m²
1 448 € /m²
60% of transactions from the 2nd to the 8th deciles.