Median price of real estate
in the municipality of Les Pavillons-sous-Bois
Houses
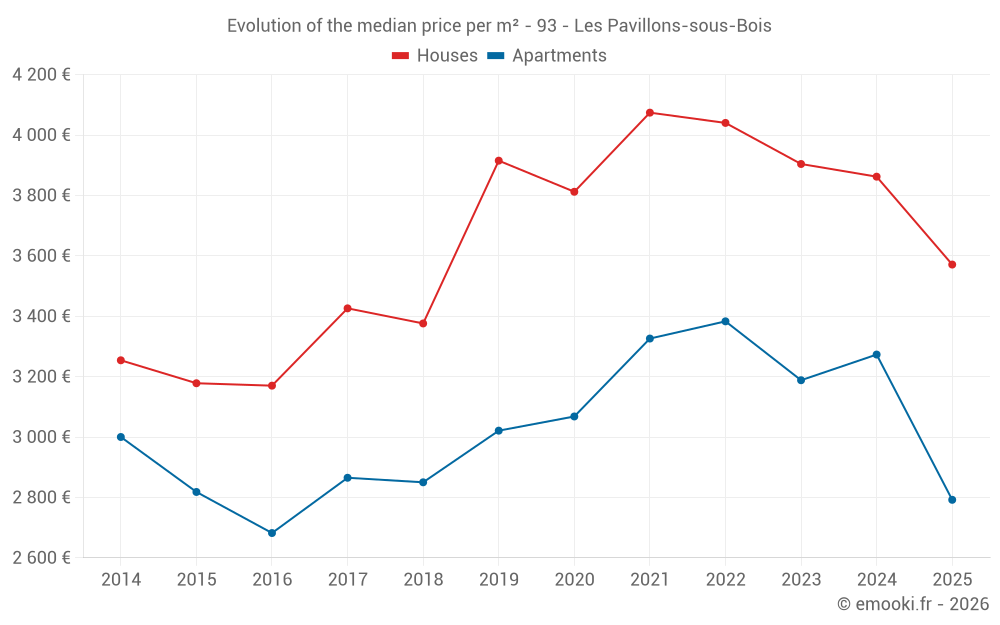
3 571 € /m²
Reliability 9/10
Median price on the 40 transactions of the last 6 months.
from 2 765 to
4 932 € /m²
4 932 € /m²
60% of transactions from the 2nd to the 8th deciles.
Apartments
2 878 € /m²
Reliability 10/10
Median price on the 29 transactions of the last 3 months.
from 2 440 to
3 470 € /m²
3 470 € /m²
60% of transactions from the 2nd to the 8th deciles.
Dwellings
2 900 € /m²
Reliability 10/10
Median price on the 45 transactions of the last 3 months.
from 2 465 to
3 739 € /m²
3 739 € /m²
60% of transactions from the 2nd to the 8th deciles.