emooki
HomePrice mapTransactions
🇬🇧 English🇫🇷 Français🇩🇪 Deutsch🇪🇸 Español🇮🇹 Italiano

Real estate price map


Real estate price map in the municipality of Sevran.

Seine-Saint-Denis (93)
Sevran

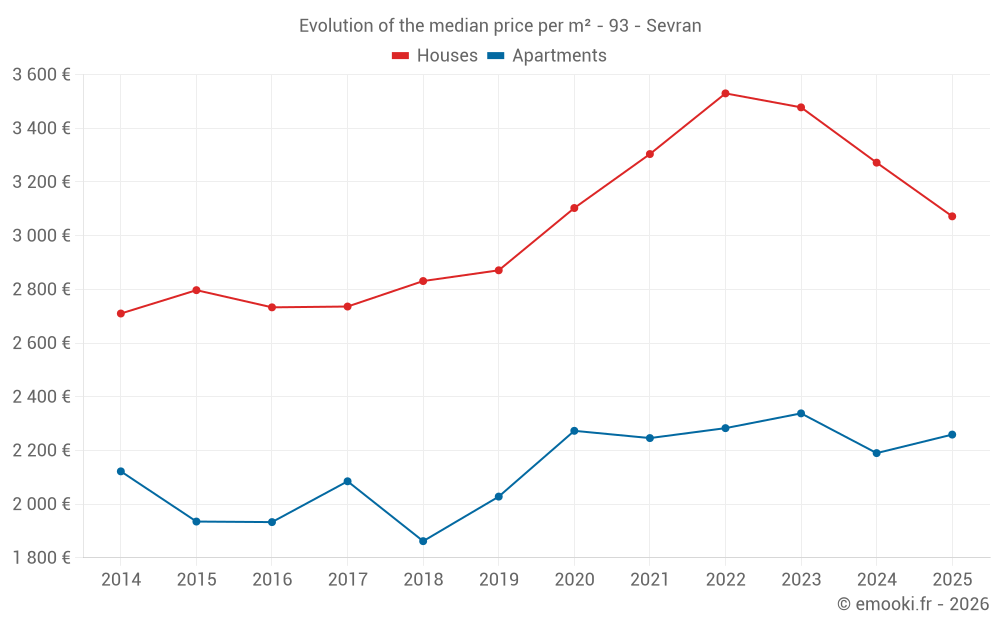
Median price of real estate
in the municipality of Sevran

HousesHouses
3 072 € /m²
1-23-45-67-89-10
Reliability 9/10
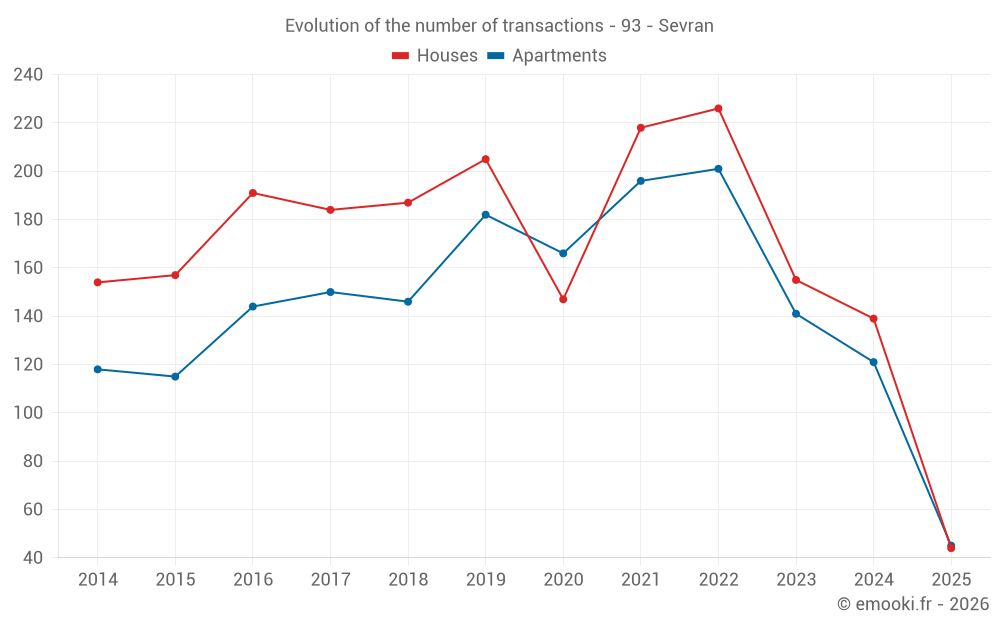
Median price on the 44 transactions of the last 6 months.
from 2 474 to
3 683 € /m²
60% of transactions from the 2nd to the 8th deciles.
ApartmentsApartments
2 259 € /m²
1-23-45-67-89-10
Reliability 9/10
Median price on the 45 transactions of the last 6 months.
from 1 818 to
2 827 € /m²
60% of transactions from the 2nd to the 8th deciles.
DwellingsDwellings
2 784 € /m²
1-23-45-67-89-10
Reliability 10/10
Median price on the 23 transactions of the last 3 months.
from 2 051 to
3 490 € /m²
60% of transactions from the 2nd to the 8th deciles.
HousesEvolution of the price per m² of houses since...
1 year
-6.1%
2 years
-12%
3 years
-13%
4 years
-7%
5 years
-1%
6 years
+7%
7 years
+8.5%
8 years
+12%
9 years
+12%
10 years
+10%
11 years
+13%
ApartmentsEvolution of the price per m² of apartments since...
1 year
+3.2%
2 years
-3.4%
3 years
-1.1%
4 years
+0.6%
5 years
-0.6%
6 years
+11%
7 years
+21%
8 years
+8.3%
9 years
+17%
10 years
+17%
11 years
+6.5%

Yearly evolution

Evolution of the median price per m²

Evolution of the number of transactions

Warning, last year incomplete. Projections made based on the proportions between semesters of the previous year at the departmental/national level and by type of property.

Yearly data

Descending order
Year
Houses
house
transactions
Houses
house
Price per m²
Apartments
apt.
transactions
Apartments
apt.
Price per m²
2025
44
3 072 €
45
2 259 €
2024
139
3 272 €
121
2 190 €
2023
155
3 478 €
141
2 338 €
2022
226
3 530 €
201
2 283 €
2021
218
3 304 €
196
2 246 €
2020
147
3 103 €
166
2 273 €
2019
205
2 871 €
182
2 028 €
2018
187
2 831 €
146
1 862 €
2017
184
2 736 €
150
2 085 €
2016
191
2 733 €
144
1 933 €
2015
157
2 797 €
115
1 935 €
2014
154
2 710 €
118
2 122 €

Analysis

Structure of prices per m²

Values of price percentiles per m² over the periods used for the estimated price of each type of property.

Structure of transaction amounts

Values of transaction amounts percentiles over the periods used for the estimated price of each type of property.

Transaction amounts and prices per m² by percentile

Ascending order
Percentile
Houses
house
Price per m²
Houses
house
Transaction amount
Apartments
apt.
Price per m²
Apartments
apt.
Transaction amount
10th percentile
2 238 €
173 K€
1 714 €
109 K€
20th percentile
2 474 €
196 K€
1 818 €
120 K€
30th percentile
2 603 €
220 K€
2 040 €
133 K€
40th percentile
2 934 €
241 K€
2 152 €
142 K€
50th percentile
3 072 €
253 K€
2 259 €
150 K€
60th percentile
3 420 €
275 K€
2 313 €
158 K€
70th percentile
3 513 €
296 K€
2 596 €
165 K€
80th percentile
3 683 €
313 K€
2 827 €
177 K€
90th percentile
4 567 €
336 K€
2 988 €
199 K€

National and departmental comparison

Evolution of the median price per m² of houses

Evolution of the median price per m² of apartments

Quarterly evolution

Evolution of the median price per m²

Evolution of the number of transactions

Quarterly data

Descending order
Quarter
Houses
house
transactions
Houses
house
Price per m²
Apartments
apt.
transactions
Apartments
apt.
Price per m²
2025 Q2
11
3 434 €
12
2 322 €
2025 Q1
33
2 974 €
33
2 204 €
2024 Q4
42
3 326 €
30
2 427 €
2024 Q3
45
3 175 €
28
2 432 €
2024 Q2
23
3 239 €
31
2 120 €
2024 Q1
29
3 272 €
32
2 117 €
2023 Q4
37
3 478 €
28
2 546 €
2023 Q3
40
3 462 €
33
2 214 €
2023 Q2
37
3 535 €
40
2 328 €
2023 Q1
41
3 250 €
40
2 401 €
2022 Q4
51
3 378 €
34
2 225 €
2022 Q3
63
3 589 €
60
2 408 €
2022 Q2
65
3 297 €
63
2 283 €
2022 Q1
47
3 811 €
44
2 247 €
2021 Q4
54
3 500 €
48
2 218 €
2021 Q3
70
3 290 €
58
2 250 €
2021 Q2
49
3 189 €
51
2 194 €
2021 Q1
45
3 352 €
39
2 424 €
2020 Q4
44
3 376 €
41
2 154 €
2020 Q3
44
3 112 €
48
2 460 €
2020 Q2
31
3 090 €
30
2 074 €
2020 Q1
28
3 000 €
47
2 342 €
2019 Q4
48
2 858 €
52
2 062 €
2019 Q3
46
2 965 €
54
2 108 €
2019 Q2
42
2 692 €
43
1 896 €
2019 Q1
69
2 986 €
33
2 103 €
2018 Q4
38
3 074 €
38
1 867 €
2018 Q3
63
2 809 €
39
1 968 €
2018 Q2
45
2 651 €
36
1 838 €
2018 Q1
41
2 923 €
33
1 793 €
2017 Q4
50
2 826 €
27
2 085 €
2017 Q3
46
2 554 €
41
2 029 €
2017 Q2
50
2 870 €
46
1 984 €
2017 Q1
38
2 650 €
36
2 324 €
2016 Q4
39
2 736 €
36
1 879 €
2016 Q3
64
2 674 €
46
1 976 €
2016 Q2
38
2 577 €
34
1 857 €
2016 Q1
50
2 834 €
28
1 930 €
2015 Q4
30
2 904 €
39
1 778 €
2015 Q3
44
2 836 €
29
1 960 €
2015 Q2
46
2 592 €
26
1 961 €
2015 Q1
37
2 797 €
21
2 042 €
2014 Q4
35
2 841 €
23
2 276 €
2014 Q3
45
2 670 €
27
2 128 €
2014 Q2
36
2 734 €
41
2 447 €
2014 Q1
38
2 757 €
27
1 915 €

Seine-Saint-Denis (93)

Most expensive cities

City
name
Descending orderHouses
house
Price per m²
7 833 €
7 653 €
6 759 €
6 673 €
6 636 €
6 158 €
5 326 €
4 828 €
4 688 €
4 611 €
City
name
Descending orderApartments
apt.
Price per m²
6 433 €
6 220 €
5 674 €
5 478 €
5 347 €
5 280 €
5 127 €
4 450 €
4 298 €
4 154 €

Least expensive cities

City
name
Ascending orderHouses
house
Price per m²
2 918 €
2 949 €
3 015 €
3 072 €
3 107 €
3 165 €
3 267 €
3 288 €
3 301 €
3 311 €
City
name
Ascending orderApartments
apt.
Price per m²
1 836 €
2 259 €
2 580 €
2 606 €
2 640 €
2 691 €
2 787 €
2 860 €
2 878 €
2 903 €