emooki
HomePrice mapTransactions
🇬🇧 English🇫🇷 Français🇩🇪 Deutsch🇪🇸 Español🇮🇹 Italiano

Real estate price map


Real estate price map in the municipality of Pantin, choose a section to see transactions by parcel.

Seine-Saint-Denis (93)

Pantin - Real estate price m²

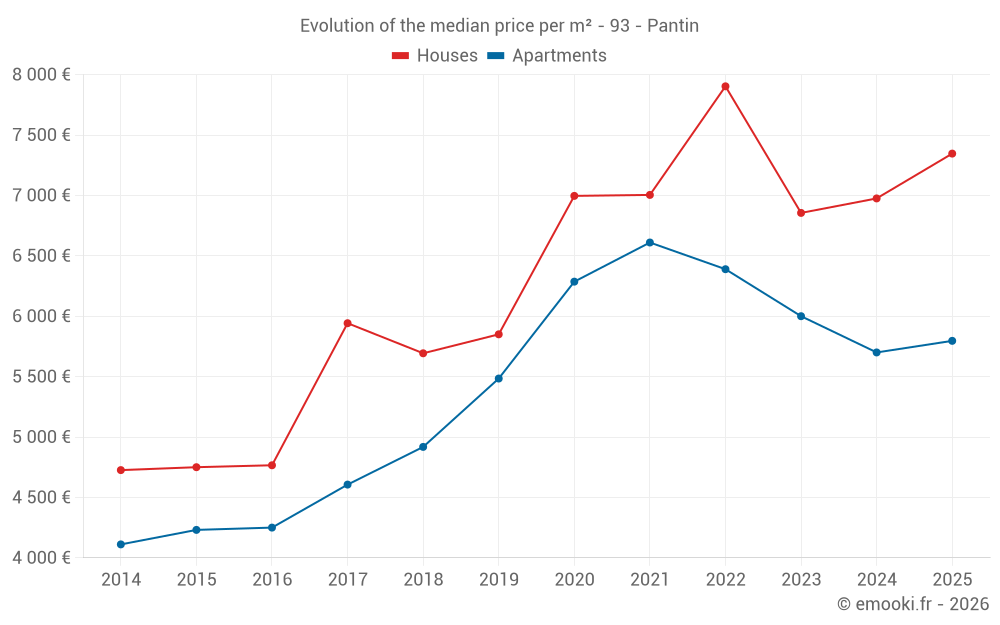
Median price of real estate
in the municipality of Pantin

HousesHouses
6 673  /m²
1-23-45-67-89-10
Reliability 8/10
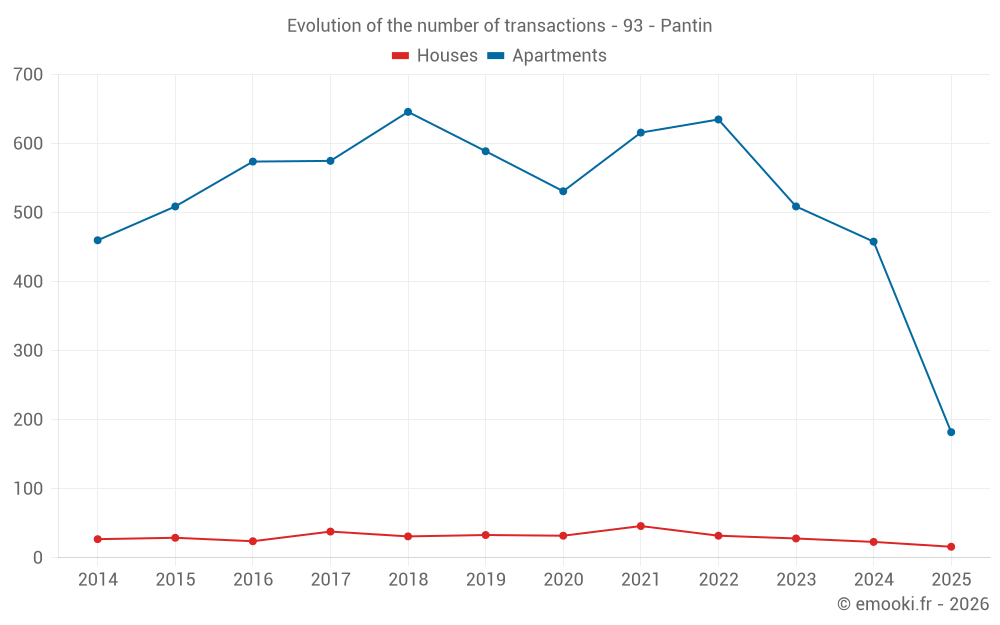
Median price on the 30 transactions of the last 12 months.
from 4 354 to
9 310  /m²
60% of transactions from the 2nd to the 8th deciles.
ApartmentsApartments
5 478  /m²
1-23-45-67-89-10
Reliability 10/10
Median price on the 54 transactions of the last 3 months.
from 3 982 to
6 569  /m²
60% of transactions from the 2nd to the 8th deciles.
DwellingsDwellings
5 484  /m²
1-23-45-67-89-10
Reliability 10/10
Median price on the 57 transactions of the last 3 months.
from 3 973 to
6 597  /m²
60% of transactions from the 2nd to the 8th deciles.
HousesEvolution of the price per m² of houses since...
1 year
+5.3%
2 years
+7.2%
3 years
-7%
4 years
+4.9%
5 years
+5%
6 years
+26%
7 years
+29%
8 years
+24%
9 years
+54%
10 years
+55%
11 years
+55%
The price per m² of houses has decreased by 7% since 3 years, but it has increased by 55% in 11 years.
ApartmentsEvolution of the price per m² of apartments since...
1 year
+1.7%
2 years
-3.4%
3 years
-9.3%
4 years
-12%
5 years
-7.8%
6 years
+5.7%
7 years
+18%
8 years
+26%
9 years
+36%
10 years
+37%
11 years
+41%
The price per m² of apartments has decreased by 12% since 4 years, but it has increased by 41% in 11 years.

Yearly evolution

Evolution of the median price per m²

Evolution of the median price per m² - 93 - Pantin

Evolution of the number of transactions

Warning, last year incomplete. Projections made based on the proportions between semesters of the previous year at the departmental/national level and by type of property.

Evolution of the number of transactions - 93 - Pantin

Yearly data

Descending order
Year
Houses
house
transactions
Houses
house
Price per m²
Apartments
apt.
transactions
Apartments
apt.
Price per m²
2025
16
7 346 
182
5 796 
2024
23
6 975 
458
5 700 
2023
28
6 855 
509
6 000 
2022
32
7 903 
635
6 389 
2021
46
7 004 
616
6 610 
2020
32
6 996 
531
6 286 
2019
33
5 850 
589
5 484 
2018
31
5 693 
646
4 918 
2017
38
5 942 
575
4 606 
2016
24
4 766 
574
4 250 
2015
29
4 750 
509
4 231 
2014
27
4 726 
460
4 111 

Analysis

Structure of prices per m²

Values of price percentiles per m² over the periods used for the estimated price of each type of property.

Structure of transaction amounts

Values of transaction amounts percentiles over the periods used for the estimated price of each type of property.

Transaction amounts and prices per m² by percentile

Ascending order
Percentile
Houses
house
Price per m²
Houses
house
Transaction amount
Apartments
apt.
Price per m²
Apartments
apt.
Transaction amount
10th percentile
3 772 
273 K
2 573 
68 180 
20th percentile
4 354 
356 K
3 982 
96 000 
30th percentile
5 749 
464 K
4 510 
155 K
40th percentile
6 263 
509 K
5 000 
195 K
50th percentile
6 673 
539 K
5 478 
279 K
60th percentile
7 619 
619 K
5 659 
305 K
70th percentile
8 325 
695 K
6 026 
361 K
80th percentile
9 310 
781 K
6 569 
412 K
90th percentile
9 986 
928 K
7 126 
522 K

National and departmental comparison

Evolution of the median price per m² of houses

Evolution of the median price per m² of apartments

Quarterly evolution

Evolution of the median price per m²

Evolution of the number of transactions

Quarterly data

Descending order
Quarter
Houses
house
transactions
Houses
house
Price per m²
Apartments
apt.
transactions
Apartments
apt.
Price per m²
2025 Q2
3
6 556 
54
5 478 
2025 Q1
13
7 355 
128
6 054 
2024 Q4
11
5 838 
123
5 676 
2024 Q3
3
9 962 
124
6 000 
2024 Q2
6
8 642 
110
5 734 
2024 Q1
3
6 975 
101
5 618 
2023 Q4
5
7 018 
107
6 000 
2023 Q3
10
4 712 
140
5 878 
2023 Q2
6
6 607 
110
6 363 
2023 Q1
7
8 201 
152
5 850 
2022 Q4
6
7 265 
161
6 171 
2022 Q3
13
7 996 
161
6 738 
2022 Q2
6
9 558 
164
6 469 
2022 Q1
7
7 558 
149
6 273 
2021 Q4
7
7 634 
153
6 038 
2021 Q3
14
6 889 
167
6 995 
2021 Q2
14
6 324 
148
6 745 
2021 Q1
11
7 724 
148
6 308 
2020 Q4
10
7 794 
173
6 432 
2020 Q3
8
7 122 
151
6 317 
2020 Q2
5
6 823 
89
6 383 
2020 Q1
9
6 610 
118
5 865 
2019 Q4
15
5 192 
157
5 417 
2019 Q3
7
7 651 
158
5 802 
2019 Q2
3
6 909 
126
5 402 
2019 Q1
8
5 220 
148
5 278 
2018 Q4
6
8 014 
163
5 196 
2018 Q3
11
5 946 
165
4 797 
2018 Q2
9
5 578 
160
4 728 
2018 Q1
5
4 313 
158
4 789 
2017 Q4
9
7 000 
150
4 715 
2017 Q3
6
6 311 
148
4 877 
2017 Q2
13
5 253 
146
4 466 
2017 Q1
10
5 526 
131
4 371 
2016 Q4
10
5 408 
151
4 032 
2016 Q3
5
4 651 
174
4 398 
2016 Q2
3
7 379 
125
4 071 
2016 Q1
6
3 494 
124
4 439 
2015 Q4
6
4 804 
149
4 141 
2015 Q3
5
3 727 
124
4 360 
2015 Q2
8
4 658 
124
4 308 
2015 Q1
10
5 240 
112
4 000 
2014 Q4
6
4 010 
106
4 061 
2014 Q3
7
5 034 
148
4 400 
2014 Q2
5
7 321 
94
3 918 
2014 Q1
9
5 295 
112
4 150 

Overview of the latest real estate transactions

The following list is an anonymized overview of the latest transactions. For more details and to find all transactions, please use the map to view transactions by plot or the transaction search page for a search by criteria.

2025-06-27
403 450 
7 078  /m²(57 m²)
Sale
Apartments
Apartment
2 rooms
57 m2
2025-06-27
3 000 000 
1 500  /m²(2000 m²)
Sale
Commercial property
2000 m2
Land
2807 m2
-Sols
2025-06-27
68 000 
3 400  /m²(20 m²)
Sale
Apartments
Apartment
1 room
20 m2
2025-06-27
486 000 
7 147  /m²(68 m²)
Sale
Apartments
Apartment
3 rooms
68 m2
1 outbuilding
2025-06-25
1 052 
88  /m²(12 m²)
Sale
Apartments
Apartment
1 room
12 m2
2025-06-20
189 320 
6 311  /m²(30 m²)
Sale
Apartments
Apartment
1 room
30 m2
1 outbuilding
2025-06-20
10 000 
Sale
1 outbuilding
2025-06-20
2 500 
74  /m²(34 m²)
Sale
Apartments
Apartment
2 rooms
34 m2
1 outbuilding
2025-06-19
480 000 
2 727  /m²(176 m²)
Sale
Commercial property
176 m2
2025-06-19
3 500 000 
6 410  /m²(546 m²)
Sale
Commercial property
138 m2
Commercial property
129 m2
Commercial property
201 m2
Commercial property
78 m2
Land
1094 m2
-Sols
2025-06-18
85 000 
5 667  /m²(15 m²)
Sale
Apartments
Apartment
1 room
15 m2
2025-06-16
105 000 
5 250  /m²(20 m²)
Sale
Apartments
Apartment
1 room
20 m2
1 outbuilding
2025-06-13
185 000 
6 607  /m²(28 m²)
Sale
Apartments
Apartment
1 room
28 m2
1 outbuilding
2025-06-11
123 000 
3 968  /m²(31 m²)
Sale
Apartments
Apartment
1 room
31 m2
2025-06-10
416 200 
7 054  /m²(59 m²)
Sale
Apartments
Apartment
3 rooms
59 m2
2025-06-05
278 400 
5 800  /m²(48 m²)
Sale
Apartments
Apartment
2 rooms
48 m2
1 outbuilding
2025-06-05
7 000 
Sale
1 outbuilding
2025-06-04
640 000 
5 517  /m²(116 m²)
Sale
Apartments
Apartment
4 rooms
116 m2
1 outbuilding
2025-06-04
295 000 
6 556  /m²(45 m²)
Sale
Houses
House
2 rooms
45 m2
2025-06-03
562 850 
5 117  /m²(110 m²)
15 635  /m²(36 m²)
Sale
Apartments
Apartment
2 rooms
36 m2
Commercial property
74 m2
10028 transactions listed in the municipality

Seine-Saint-Denis (93)

Most expensive cities

City
name
Descending orderHouses
house
Price per m²
7 653 
6 673 
6 636 
6 158 
5 326 
4 828 
4 688 
4 611 
City
name
Descending orderApartments
apt.
Price per m²
6 220 
5 478 
5 347 
5 280 
5 127 
4 450 

Least expensive cities

City
name
Ascending orderHouses
house
Price per m²
2 918 
2 949 
3 015 
3 072 
3 107 
3 165 
3 267 
3 288 
3 311 
City
name
Ascending orderApartments
apt.
Price per m²
1 836 
2 259 
2 580 
2 640 
2 691 
2 787 
2 860