emooki
HomePrice mapTransactions
🇬🇧 English🇫🇷 Français🇩🇪 Deutsch🇪🇸 Español🇮🇹 Italiano

Real estate price map


Real estate price map in the municipality of Vaujours.

Seine-Saint-Denis (93)
Vaujours

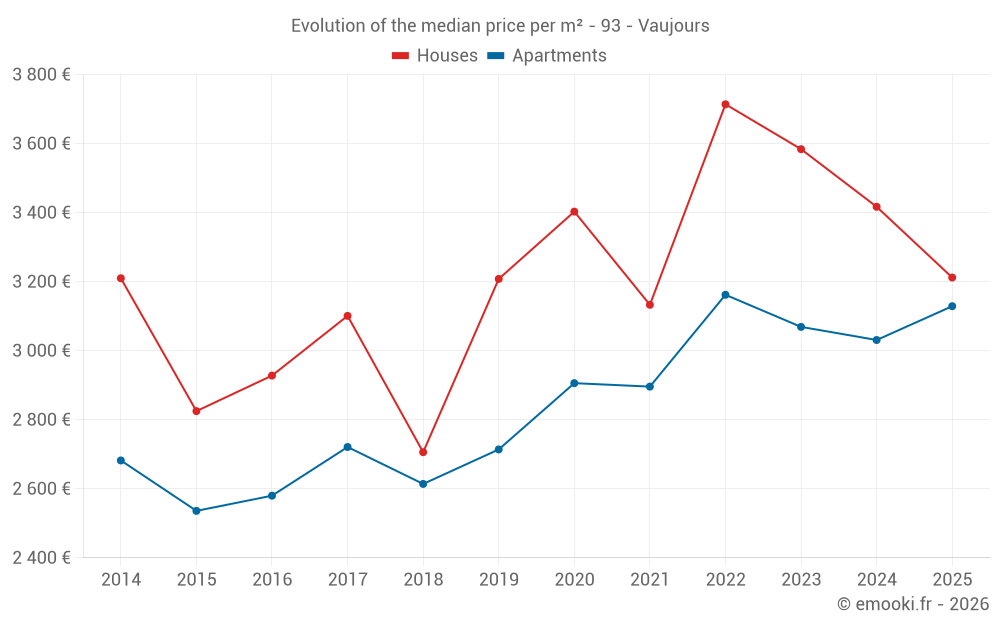
Median price of real estate
in the municipality of Vaujours

HousesHouses
3 459 € /m²
1-23-45-67-89-10
Reliability 8/10
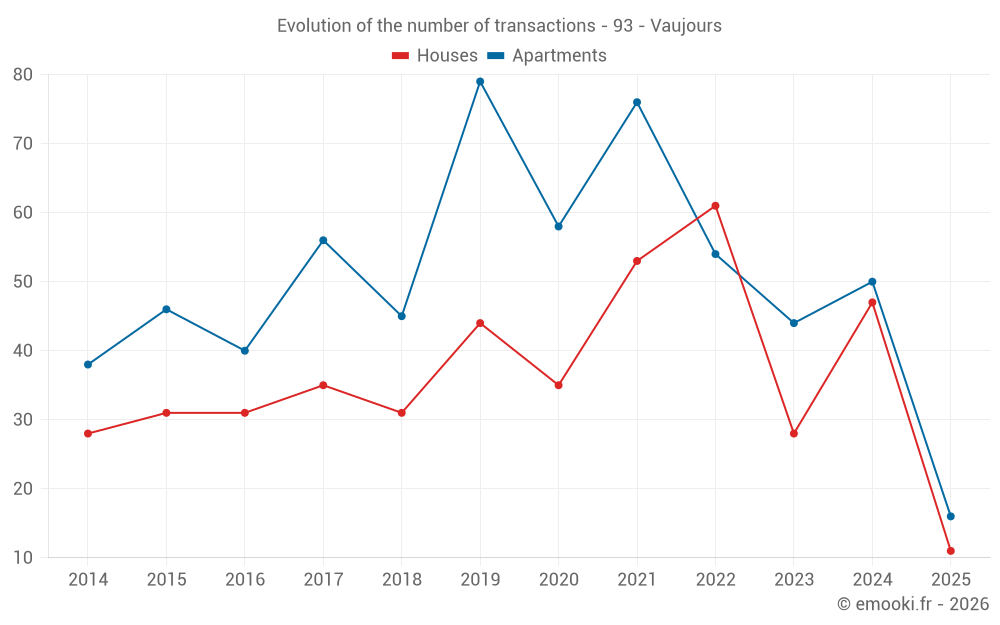
Median price on the 37 transactions of the last 12 months.
from 2 954 to
5 077 € /m²
60% of transactions from the 2nd to the 8th deciles.
ApartmentsApartments
3 123 € /m²
1-23-45-67-89-10
Reliability 8/10
Median price on the 43 transactions of the last 12 months.
from 2 607 to
3 679 € /m²
60% of transactions from the 2nd to the 8th deciles.
DwellingsDwellings
3 182 € /m²
1-23-45-67-89-10
Reliability 9/10
Median price on the 27 transactions of the last 6 months.
from 2 660 to
3 828 € /m²
60% of transactions from the 2nd to the 8th deciles.
HousesEvolution of the price per m² of houses since...
1 year
-6%
2 years
-10%
3 years
-14%
4 years
+2.5%
5 years
-5.6%
6 years
+0.1%
7 years
+19%
8 years
+3.6%
9 years
+10%
10 years
+14%
11 years
+0.1%
ApartmentsEvolution of the price per m² of apartments since...
1 year
+3.2%
2 years
+2%
3 years
-1%
4 years
+8%
5 years
+7.7%
6 years
+15%
7 years
+20%
8 years
+15%
9 years
+21%
10 years
+23%
11 years
+17%

Yearly evolution

Evolution of the median price per m²

Evolution of the number of transactions

Warning, last year incomplete. Projections made based on the proportions between semesters of the previous year at the departmental/national level and by type of property.

Yearly data

Descending order
Year
Houses
house
transactions
Houses
house
Price per m²
Apartments
apt.
transactions
Apartments
apt.
Price per m²
2025
11
3 212 €
16
3 129 €
2024
47
3 417 €
50
3 031 €
2023
28
3 584 €
44
3 069 €
2022
61
3 714 €
54
3 162 €
2021
53
3 133 €
76
2 896 €
2020
35
3 403 €
58
2 906 €
2019
44
3 208 €
79
2 714 €
2018
31
2 706 €
45
2 614 €
2017
35
3 101 €
56
2 721 €
2016
31
2 928 €
40
2 580 €
2015
31
2 825 €
46
2 536 €
2014
28
3 210 €
38
2 682 €

Analysis

Structure of prices per m²

Values of price percentiles per m² over the periods used for the estimated price of each type of property.

Structure of transaction amounts

Values of transaction amounts percentiles over the periods used for the estimated price of each type of property.

Transaction amounts and prices per m² by percentile

Ascending order
Percentile
Houses
house
Price per m²
Houses
house
Transaction amount
Apartments
apt.
Price per m²
Apartments
apt.
Transaction amount
10th percentile
2 633 €
205 K€
2 446 €
113 K€
20th percentile
2 954 €
253 K€
2 607 €
126 K€
30th percentile
3 166 €
266 K€
2 894 €
152 K€
40th percentile
3 260 €
270 K€
3 054 €
165 K€
50th percentile
3 459 €
295 K€
3 123 €
174 K€
60th percentile
3 782 €
303 K€
3 394 €
209 K€
70th percentile
4 055 €
331 K€
3 536 €
214 K€
80th percentile
5 077 €
362 K€
3 679 €
230 K€
90th percentile
5 587 €
590 K€
3 923 €
276 K€

National and departmental comparison

Evolution of the median price per m² of houses

Evolution of the median price per m² of apartments

Quarterly evolution

Evolution of the median price per m²

Evolution of the number of transactions

Quarterly data

Descending order
Quarter
Houses
house
transactions
Houses
house
Price per m²
Apartments
apt.
transactions
Apartments
apt.
Price per m²
2025 Q2
2
2 936 €
9
3 123 €
2025 Q1
9
3 212 €
7
3 432 €
2024 Q4
11
3 499 €
13
3 173 €
2024 Q3
15
3 723 €
14
3 074 €
2024 Q2
13
3 241 €
12
2 847 €
2024 Q1
8
3 323 €
11
2 865 €
2023 Q4
5
3 441 €
8
2 455 €
2023 Q3
2
4 389 €
6
3 246 €
2023 Q2
10
3 651 €
16
3 017 €
2023 Q1
11
3 621 €
14
3 596 €
2022 Q4
9
4 176 €
13
3 190 €
2022 Q3
14
3 466 €
17
3 059 €
2022 Q2
17
3 864 €
12
2 990 €
2022 Q1
21
3 667 €
12
3 199 €
2021 Q4
10
2 963 €
22
2 696 €
2021 Q3
22
2 967 €
20
3 094 €
2021 Q2
13
3 603 €
19
2 885 €
2021 Q1
8
3 437 €
15
2 800 €
2020 Q4
8
3 418 €
16
3 046 €
2020 Q3
10
2 885 €
13
2 771 €
2020 Q2
5
2 804 €
12
2 922 €
2020 Q1
12
3 592 €
17
2 718 €
2019 Q4
12
3 362 €
24
2 688 €
2019 Q3
15
3 273 €
18
2 432 €
2019 Q2
6
3 068 €
12
2 794 €
2019 Q1
11
3 210 €
25
2 955 €
2018 Q4
8
3 016 €
10
2 536 €
2018 Q3
9
3 259 €
10
2 868 €
2018 Q2
5
2 418 €
14
2 519 €
2018 Q1
9
2 385 €
11
2 558 €
2017 Q4
13
3 305 €
12
3 089 €
2017 Q3
8
2 546 €
11
2 641 €
2017 Q2
3
3 526 €
19
2 713 €
2017 Q1
11
2 787 €
14
2 747 €
2016 Q4
12
3 282 €
9
2 589 €
2016 Q3
6
2 904 €
17
2 571 €
2016 Q2
7
2 949 €
9
2 412 €
2016 Q1
6
2 456 €
5
3 023 €
2015 Q4
10
3 086 €
9
2 464 €
2015 Q3
5
2 918 €
13
2 565 €
2015 Q2
12
2 497 €
10
2 366 €
2015 Q1
4
2 957 €
14
2 507 €
2014 Q4
3
5 385 €
6
2 786 €
2014 Q3
10
3 095 €
8
3 092 €
2014 Q2
10
2 948 €
10
3 254 €
2014 Q1
5
3 375 €
14
2 632 €

Seine-Saint-Denis (93)

Most expensive cities

City
name
Descending orderHouses
house
Price per m²
7 833 €
7 653 €
6 759 €
6 673 €
6 636 €
6 158 €
5 326 €
4 828 €
4 688 €
4 611 €
City
name
Descending orderApartments
apt.
Price per m²
6 433 €
6 220 €
5 674 €
5 478 €
5 347 €
5 280 €
5 127 €
4 450 €
4 298 €
4 154 €

Least expensive cities

City
name
Ascending orderHouses
house
Price per m²
2 918 €
2 949 €
3 015 €
3 072 €
3 107 €
3 165 €
3 267 €
3 288 €
3 301 €
3 311 €
City
name
Ascending orderApartments
apt.
Price per m²
1 836 €
2 259 €
2 580 €
2 606 €
2 640 €
2 691 €
2 787 €
2 860 €
2 878 €
2 903 €