emooki
HomePrice mapTransactions
🇬🇧 English🇫🇷 Français🇩🇪 Deutsch🇪🇸 Español🇮🇹 Italiano

Real estate price map


Real estate price map in the municipality of Bagnolet, choose a section to see transactions by parcel.

Seine-Saint-Denis (93)

Bagnolet - Real estate price m²

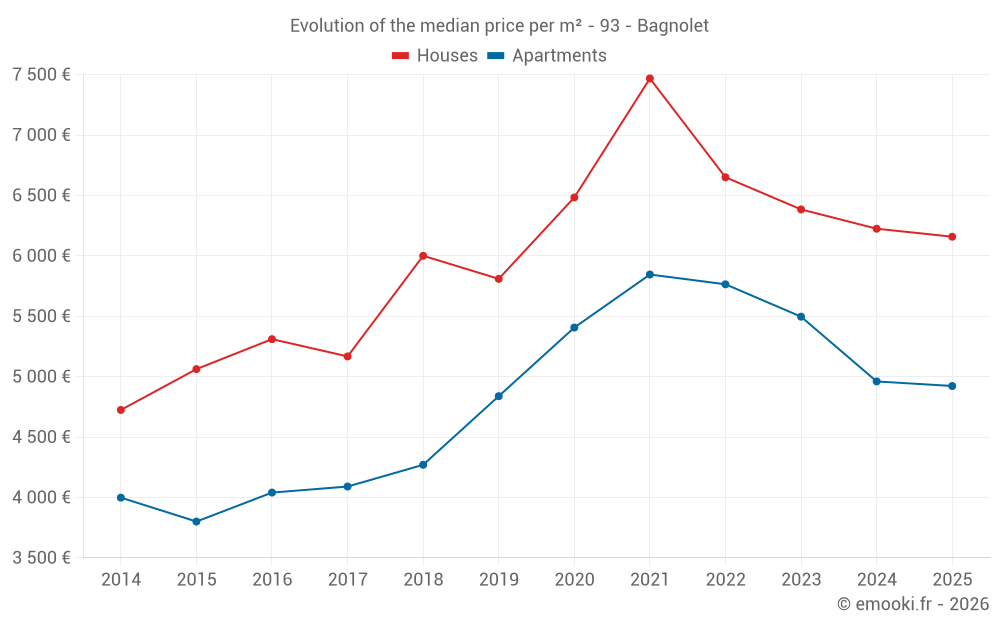
Median price of real estate
in the municipality of Bagnolet

HousesHouses
6 158  /m²
1-23-45-67-89-10
Reliability 8/10
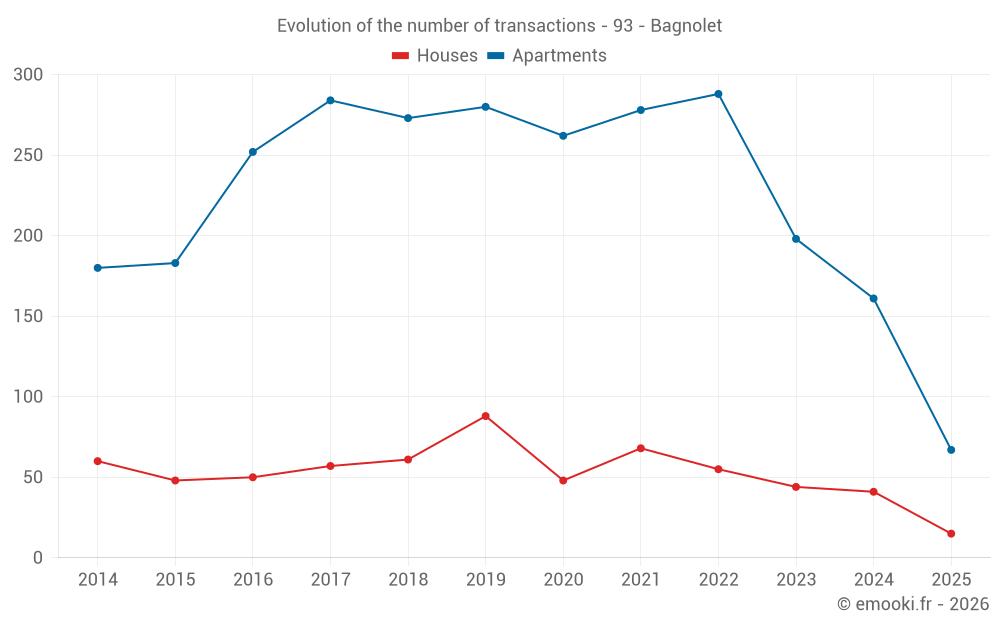
Median price on the 37 transactions of the last 12 months.
from 4 020 to
8 350  /m²
60% of transactions from the 2nd to the 8th deciles.
ApartmentsApartments
5 127  /m²
1-23-45-67-89-10
Reliability 10/10
Median price on the 21 transactions of the last 3 months.
from 4 200 to
6 129  /m²
60% of transactions from the 2nd to the 8th deciles.
DwellingsDwellings
5 170  /m²
1-23-45-67-89-10
Reliability 10/10
Median price on the 28 transactions of the last 3 months.
from 4 319 to
6 376  /m²
60% of transactions from the 2nd to the 8th deciles.
HousesEvolution of the price per m² of houses since...
1 year
-1.1%
2 years
-3.5%
3 years
-7.4%
4 years
-18%
5 years
-5%
6 years
+6%
7 years
+2.6%
8 years
+19%
9 years
+16%
10 years
+22%
11 years
+30%
The price per m² of houses has decreased by 18% since 4 years, but it has increased by 30% in 11 years.
ApartmentsEvolution of the price per m² of apartments since...
1 year
-0.8%
2 years
-10%
3 years
-15%
4 years
-16%
5 years
-9%
6 years
+1.7%
7 years
+15%
8 years
+20%
9 years
+22%
10 years
+30%
11 years
+23%
The price per m² of apartments has decreased by 16% since 4 years, but it has increased by 30% in 10 years.

Yearly evolution

Evolution of the median price per m²

Evolution of the median price per m² - 93 - Bagnolet

Evolution of the number of transactions

Warning, last year incomplete. Projections made based on the proportions between semesters of the previous year at the departmental/national level and by type of property.

Evolution of the number of transactions - 93 - Bagnolet

Yearly data

Descending order
Year
Houses
house
transactions
Houses
house
Price per m²
Apartments
apt.
transactions
Apartments
apt.
Price per m²
2025
15
6 158 
67
4 922 
2024
41
6 224 
161
4 960 
2023
44
6 384 
198
5 496 
2022
55
6 650 
288
5 764 
2021
68
7 468 
278
5 845 
2020
48
6 483 
262
5 406 
2019
88
5 809 
280
4 838 
2018
61
6 000 
273
4 270 
2017
57
5 167 
284
4 090 
2016
50
5 310 
252
4 040 
2015
48
5 062 
183
3 800 
2014
60
4 724 
180
3 998 

Analysis

Structure of prices per m²

Values of price percentiles per m² over the periods used for the estimated price of each type of property.

Structure of transaction amounts

Values of transaction amounts percentiles over the periods used for the estimated price of each type of property.

Transaction amounts and prices per m² by percentile

Ascending order
Percentile
Houses
house
Price per m²
Houses
house
Transaction amount
Apartments
apt.
Price per m²
Apartments
apt.
Transaction amount
10th percentile
2 925 
152 K
3 933 
120 K
20th percentile
4 020 
212 K
4 200 
170 K
30th percentile
4 910 
304 K
4 586 
210 K
40th percentile
5 290 
330 K
4 922 
215 K
50th percentile
6 158 
370 K
5 127 
235 K
60th percentile
6 555 
466 K
5 683 
290 K
70th percentile
7 357 
626 K
6 047 
315 K
80th percentile
8 350 
663 K
6 129 
386 K
90th percentile
10 356 
784 K
7 344 
399 K

National and departmental comparison

Evolution of the median price per m² of houses

Evolution of the median price per m² of apartments

Quarterly evolution

Evolution of the median price per m²

Evolution of the number of transactions

Quarterly data

Descending order
Quarter
Houses
house
transactions
Houses
house
Price per m²
Apartments
apt.
transactions
Apartments
apt.
Price per m²
2025 Q2
7
6 158 
21
5 127 
2025 Q1
8
5 878 
46
4 828 
2024 Q4
12
5 077 
41
4 614 
2024 Q3
10
6 930 
41
5 032 
2024 Q2
12
7 240 
49
5 355 
2024 Q1
7
3 824 
30
4 412 
2023 Q4
11
6 214 
36
5 608 
2023 Q3
15
7 056 
52
5 276 
2023 Q2
8
6 576 
56
5 580 
2023 Q1
10
5 834 
54
5 536 
2022 Q4
15
7 448 
64
5 598 
2022 Q3
16
6 168 
72
6 000 
2022 Q2
14
6 296 
74
5 801 
2022 Q1
10
6 656 
78
5 636 
2021 Q4
19
7 381 
61
5 893 
2021 Q3
21
7 292 
81
6 417 
2021 Q2
14
7 773 
73
6 000 
2021 Q1
14
7 811 
63
5 379 
2020 Q4
8
6 365 
81
5 789 
2020 Q3
17
5 953 
59
5 500 
2020 Q2
10
5 592 
61
5 185 
2020 Q1
13
7 143 
61
4 829 
2019 Q4
31
5 988 
70
4 577 
2019 Q3
25
5 545 
81
4 861 
2019 Q2
10
7 290 
72
4 749 
2019 Q1
22
5 228 
57
5 318 
2018 Q4
14
5 866 
75
4 608 
2018 Q3
23
6 000 
73
4 270 
2018 Q2
14
6 204 
71
4 273 
2018 Q1
10
5 340 
54
3 965 
2017 Q4
11
5 319 
66
4 020 
2017 Q3
22
4 972 
72
4 245 
2017 Q2
11
5 862 
85
4 180 
2017 Q1
13
5 682 
61
4 022 
2016 Q4
13
6 122 
79
3 898 
2016 Q3
12
5 190 
70
4 381 
2016 Q2
13
5 023 
59
4 163 
2016 Q1
12
4 063 
44
3 395 
2015 Q4
10
5 264 
46
3 704 
2015 Q3
14
4 884 
53
3 796 
2015 Q2
13
4 312 
38
3 828 
2015 Q1
11
5 447 
46
3 998 
2014 Q4
10
5 493 
44
4 102 
2014 Q3
18
4 836 
59
3 844 
2014 Q2
9
4 519 
28
3 929 
2014 Q1
23
4 639 
49
4 255 

Overview of the latest real estate transactions

The following list is an anonymized overview of the latest transactions. For more details and to find all transactions, please use the map to view transactions by plot or the transaction search page for a search by criteria.

2025-06-27
288 000 
6 128  /m²(47 m²)
Sale
Apartments
Apartment
2 rooms
47 m2
1 outbuilding
2025-06-27
4 100 000 
6 165  /m²(665 m²)
Sale
Commercial property
665 m2
Land
820 m2
-Sols
2025-06-27
1 603 000 
14 843  /m²(108 m²)
Sale
Land
89 m2
-Sols
Land
141 m2
-Sols
Land
40 m2
-Sols
Land
255 m2
-Sols
Land
151 m2
-Sols
Land
45 m2
-Sols
Land
106 m2
-Sols
Houses
House
1 room
20 m2
1 outbuilding
Houses
House
2 rooms
28 m2
Houses
House
4 rooms
60 m2
2025-06-27
370 000 
11 935  /m²(31 m²)
Sale
Houses
House
2 rooms
31 m2
2025-06-27
1 600 000 
9 143  /m²(175 m²)
26 667  /m²(60 m²)
Sale
Houses
House
3 rooms
60 m2
Commercial property
115 m2
Land
435 m2
-Sols
2025-06-26
404 900 
Sale
1 outbuilding
2025-06-26
310 000 
5 000  /m²(62 m²)
Sale
Apartments
Apartment
3 rooms
62 m2
1 outbuilding
2025-06-25
900 000 
1 848  /m²(487 m²)
8 333  /m²(108 m²)
Sale
Houses
House
4 rooms
108 m2
Commercial property
379 m2
2 outbuildings
Land
340 m2
-Sols
2025-06-20
59 000 
3 933  /m²(15 m²)
Sale
Apartments
Apartment
1 room
15 m2
1 outbuilding
2025-06-19
215 000 
6 143  /m²(35 m²)
Sale
Apartments
Apartment
2 rooms
35 m2
2025-06-18
217 700 
6 047  /m²(36 m²)
Sale
Apartments
Apartment
1 room
36 m2
1 outbuilding
2025-06-17
320 000 
4 923  /m²(65 m²)
Sale
Houses
House
4 rooms
65 m2
1 outbuilding
Land
118 m2
-Sols
2025-06-13
320 000 
4 923  /m²(65 m²)
Sale
Houses
House
2 rooms
65 m2
Land
105 m2
-Sols
2025-06-11
210 000 
4 200  /m²(50 m²)
Sale
Apartments
Apartment
2 rooms
50 m2
1 outbuilding
2025-06-05
399 000 
4 586  /m²(87 m²)
Sale
1 outbuilding
Apartments
Apartment
3 rooms
87 m2
1 outbuilding
2025-06-04
405 000 
5 127  /m²(79 m²)
Sale
Apartments
Apartment
4 rooms
79 m2
1 outbuilding
2025-05-28
12 500 
Sale
1 outbuilding
2025-05-28
213 750 
5 213  /m²(41 m²)
Sale
Apartments
Apartment
2 rooms
41 m2
1 outbuilding
2025-05-26
13 100 
Sale
1 outbuilding
2025-05-26
360 000 
3 000  /m²(120 m²)
Sale
Commercial property
120 m2
Land
183 m2
-Sols
5647 transactions listed in the municipality

Seine-Saint-Denis (93)

Most expensive cities

City
name
Descending orderHouses
house
Price per m²
7 653 
6 673 
6 636 
6 158 
5 326 
4 828 
4 688 
4 611 
City
name
Descending orderApartments
apt.
Price per m²
6 220 
5 478 
5 347 
5 280 
5 127 
4 450 

Least expensive cities

City
name
Ascending orderHouses
house
Price per m²
2 918 
2 949 
3 015 
3 072 
3 107 
3 165 
3 267 
3 288 
3 311 
City
name
Ascending orderApartments
apt.
Price per m²
1 836 
2 259 
2 580 
2 640 
2 691 
2 787 
2 860