emooki
HomePrice mapTransactions
🇬🇧 English🇫🇷 Français🇩🇪 Deutsch🇪🇸 Español🇮🇹 Italiano

Real estate price map


Real estate price map in the municipality of Rosny-sous-Bois.

Seine-Saint-Denis (93)
Rosny-sous-Bois

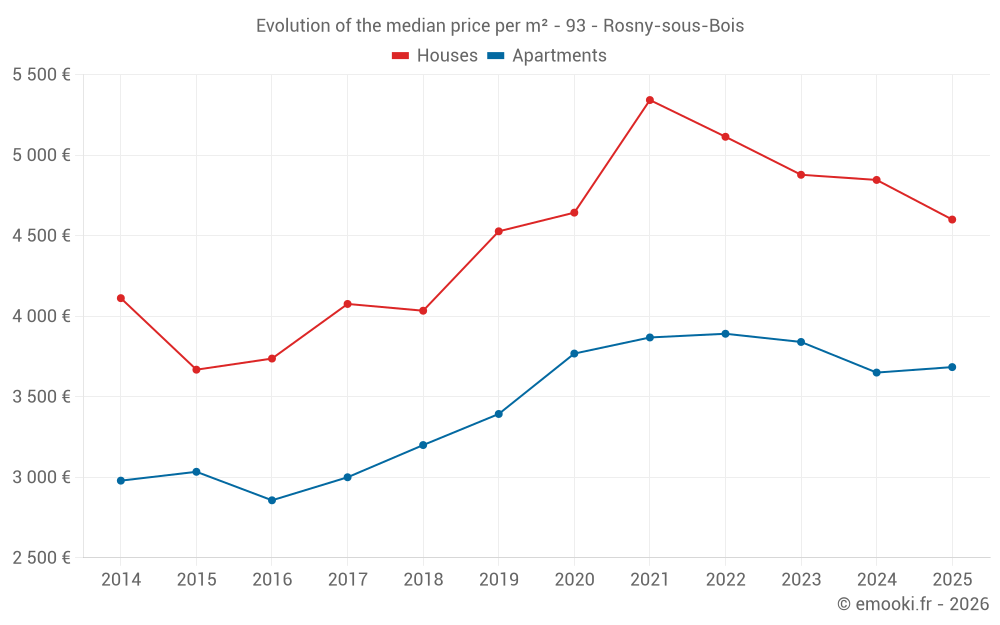
Median price of real estate
in the municipality of Rosny-sous-Bois

HousesHouses
4 600 € /m²
1-23-45-67-89-10
Reliability 9/10
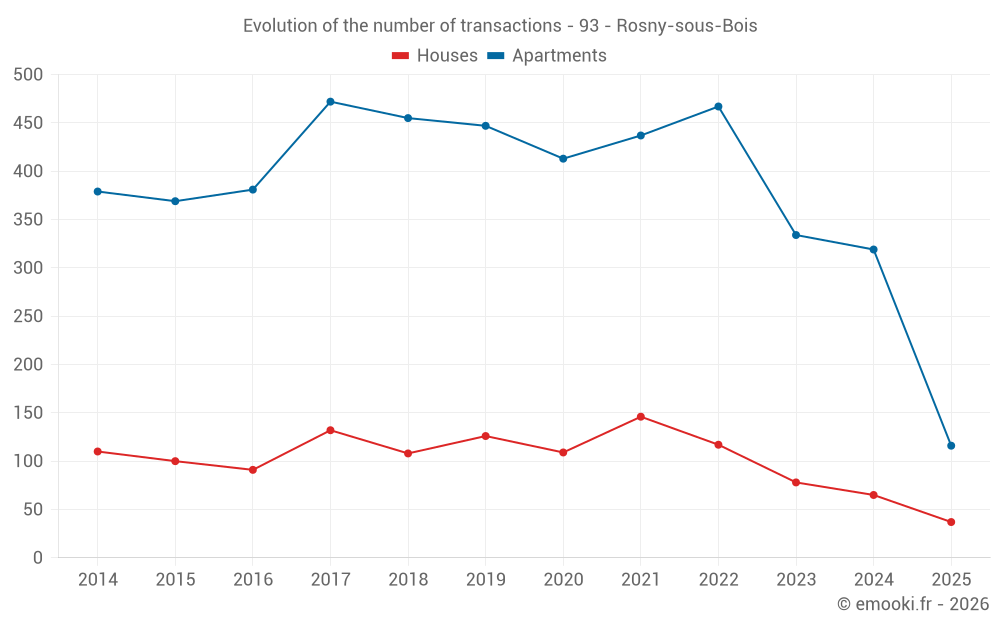
Median price on the 37 transactions of the last 6 months.
from 3 473 to
6 451 € /m²
60% of transactions from the 2nd to the 8th deciles.
ApartmentsApartments
3 951 € /m²
1-23-45-67-89-10
Reliability 10/10
Median price on the 39 transactions of the last 3 months.
from 3 150 to
4 925 € /m²
60% of transactions from the 2nd to the 8th deciles.
DwellingsDwellings
4 090 € /m²
1-23-45-67-89-10
Reliability 10/10
Median price on the 58 transactions of the last 3 months.
from 3 186 to
5 168 € /m²
60% of transactions from the 2nd to the 8th deciles.
HousesEvolution of the price per m² of houses since...
1 year
-5.1%
2 years
-5.7%
3 years
-10%
4 years
-14%
5 years
-0.9%
6 years
+1.6%
7 years
+14%
8 years
+13%
9 years
+23%
10 years
+25%
11 years
+12%
ApartmentsEvolution of the price per m² of apartments since...
1 year
+0.9%
2 years
-4.1%
3 years
-5.3%
4 years
-4.8%
5 years
-2.2%
6 years
+8.6%
7 years
+15%
8 years
+23%
9 years
+29%
10 years
+21%
11 years
+24%

Yearly evolution

Evolution of the median price per m²

Evolution of the number of transactions

Warning, last year incomplete. Projections made based on the proportions between semesters of the previous year at the departmental/national level and by type of property.

Yearly data

Descending order
Year
Houses
house
transactions
Houses
house
Price per m²
Apartments
apt.
transactions
Apartments
apt.
Price per m²
2025
37
4 600 €
116
3 684 €
2024
65
4 846 €
319
3 650 €
2023
78
4 878 €
334
3 840 €
2022
117
5 114 €
467
3 891 €
2021
146
5 342 €
437
3 868 €
2020
109
4 643 €
413
3 768 €
2019
126
4 527 €
447
3 393 €
2018
108
4 034 €
455
3 200 €
2017
132
4 076 €
472
3 000 €
2016
91
3 737 €
381
2 857 €
2015
100
3 668 €
369
3 034 €
2014
110
4 112 €
379
2 979 €

Analysis

Structure of prices per m²

Values of price percentiles per m² over the periods used for the estimated price of each type of property.

Structure of transaction amounts

Values of transaction amounts percentiles over the periods used for the estimated price of each type of property.

Transaction amounts and prices per m² by percentile

Ascending order
Percentile
Houses
house
Price per m²
Houses
house
Transaction amount
Apartments
apt.
Price per m²
Apartments
apt.
Transaction amount
10th percentile
2 789 €
215 K€
2 221 €
83 900 €
20th percentile
3 473 €
255 K€
3 150 €
95 700 €
30th percentile
3 753 €
318 K€
3 357 €
112 K€
40th percentile
4 133 €
361 K€
3 737 €
160 K€
50th percentile
4 600 €
375 K€
3 951 €
167 K€
60th percentile
5 165 €
415 K€
4 154 €
194 K€
70th percentile
5 628 €
492 K€
4 355 €
209 K€
80th percentile
6 451 €
509 K€
4 925 €
230 K€
90th percentile
7 708 €
540 K€
5 193 €
278 K€

National and departmental comparison

Evolution of the median price per m² of houses

Evolution of the median price per m² of apartments

Quarterly evolution

Evolution of the median price per m²

Evolution of the number of transactions

Quarterly data

Descending order
Quarter
Houses
house
transactions
Houses
house
Price per m²
Apartments
apt.
transactions
Apartments
apt.
Price per m²
2025 Q2
19
4 396 €
39
3 951 €
2025 Q1
18
4 896 €
77
3 452 €
2024 Q4
23
4 846 €
80
3 664 €
2024 Q3
19
4 714 €
82
3 665 €
2024 Q2
13
4 006 €
74
3 340 €
2024 Q1
10
5 345 €
83
3 813 €
2023 Q4
17
4 906 €
64
3 532 €
2023 Q3
26
4 858 €
78
3 918 €
2023 Q2
18
4 788 €
109
3 987 €
2023 Q1
17
4 970 €
83
3 868 €
2022 Q4
30
5 408 €
88
3 838 €
2022 Q3
33
4 957 €
133
3 914 €
2022 Q2
28
4 972 €
122
3 999 €
2022 Q1
26
5 264 €
124
3 831 €
2021 Q4
32
5 214 €
94
3 902 €
2021 Q3
50
5 455 €
133
3 936 €
2021 Q2
28
5 318 €
118
3 828 €
2021 Q1
36
5 301 €
92
3 795 €
2020 Q4
21
4 536 €
115
3 889 €
2020 Q3
28
4 588 €
102
3 639 €
2020 Q2
32
5 134 €
100
3 728 €
2020 Q1
28
4 283 €
96
3 792 €
2019 Q4
37
4 677 €
105
3 328 €
2019 Q3
36
4 696 €
130
3 500 €
2019 Q2
27
4 673 €
108
3 379 €
2019 Q1
26
4 036 €
104
3 184 €
2018 Q4
25
4 045 €
105
3 463 €
2018 Q3
35
4 022 €
117
3 208 €
2018 Q2
25
3 964 €
121
3 066 €
2018 Q1
23
4 058 €
112
3 042 €
2017 Q4
35
4 023 €
113
2 879 €
2017 Q3
43
4 057 €
130
3 026 €
2017 Q2
36
4 087 €
117
3 038 €
2017 Q1
18
4 004 €
112
2 912 €
2016 Q4
15
3 589 €
89
2 764 €
2016 Q3
31
3 667 €
107
3 040 €
2016 Q2
23
4 048 €
94
2 827 €
2016 Q1
22
3 681 €
91
2 830 €
2015 Q4
26
3 922 €
83
3 101 €
2015 Q3
34
3 551 €
110
2 990 €
2015 Q2
20
3 388 €
98
3 031 €
2015 Q1
20
3 639 €
78
3 028 €
2014 Q4
27
3 977 €
104
2 830 €
2014 Q3
33
4 060 €
94
3 023 €
2014 Q2
20
4 371 €
79
3 070 €
2014 Q1
30
4 091 €
102
2 973 €

Seine-Saint-Denis (93)

Most expensive cities

City
name
Descending orderHouses
house
Price per m²
7 833 €
7 653 €
6 759 €
6 673 €
6 636 €
6 158 €
5 326 €
4 828 €
4 688 €
4 611 €
City
name
Descending orderApartments
apt.
Price per m²
6 433 €
6 220 €
5 674 €
5 478 €
5 347 €
5 280 €
5 127 €
4 450 €
4 298 €
4 154 €

Least expensive cities

City
name
Ascending orderHouses
house
Price per m²
2 918 €
2 949 €
3 015 €
3 072 €
3 107 €
3 165 €
3 267 €
3 288 €
3 301 €
3 311 €
City
name
Ascending orderApartments
apt.
Price per m²
1 836 €
2 259 €
2 580 €
2 606 €
2 640 €
2 691 €
2 787 €
2 860 €
2 878 €
2 903 €