emooki
HomePrice mapTransactions
🇬🇧 English🇫🇷 Français🇩🇪 Deutsch🇪🇸 Español🇮🇹 Italiano

Real estate price map


Real estate price map in the municipality of Aulnay-sous-Bois.

Seine-Saint-Denis (93)
Aulnay-sous-Bois

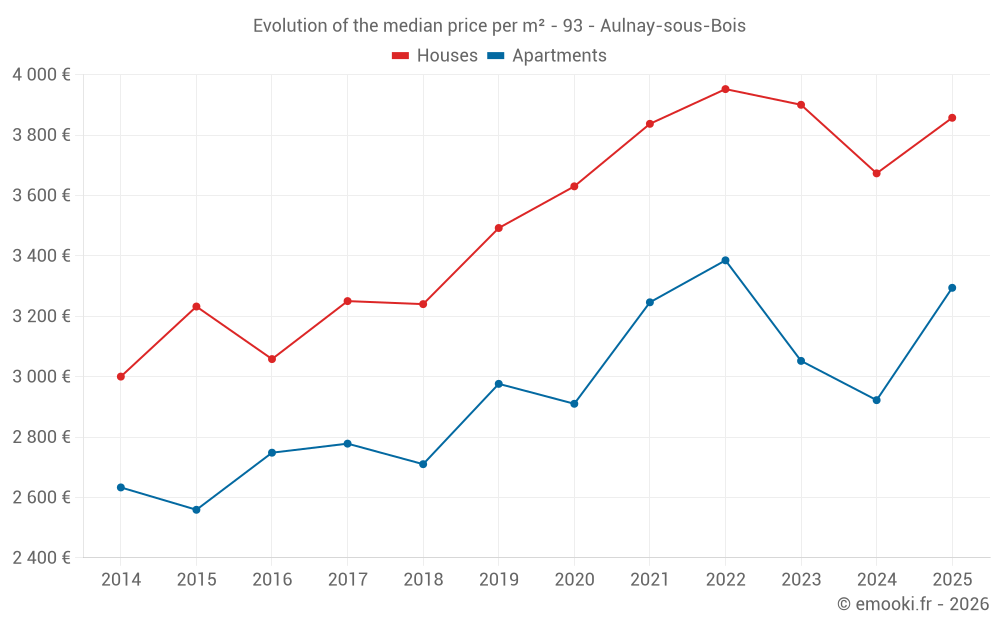
Median price of real estate
in the municipality of Aulnay-sous-Bois

HousesHouses
4 000 € /m²
1-23-45-67-89-10
Reliability 10/10
Median price on the 51 transactions of the last 3 months.
from 3 196 to
5 194 € /m²
60% of transactions from the 2nd to the 8th deciles.
ApartmentsApartments
3 624 € /m²
1-23-45-67-89-10
Reliability 10/10
Median price on the 30 transactions of the last 3 months.
from 2 288 to
4 265 € /m²
60% of transactions from the 2nd to the 8th deciles.
DwellingsDwellings
3 846 € /m²
1-23-45-67-89-10
Reliability 10/10
Median price on the 81 transactions of the last 3 months.
from 2 922 to
4 583 € /m²
60% of transactions from the 2nd to the 8th deciles.
HousesEvolution of the price per m² of houses since...
1 year
+5%
2 years
-1.1%
3 years
-2.4%
4 years
+0.5%
5 years
+6.3%
6 years
+10%
7 years
+19%
8 years
+19%
9 years
+26%
10 years
+19%
11 years
+29%
ApartmentsEvolution of the price per m² of apartments since...
1 year
+13%
2 years
+7.9%
3 years
-2.7%
4 years
+1.5%
5 years
+13%
6 years
+11%
7 years
+22%
8 years
+19%
9 years
+20%
10 years
+29%
11 years
+25%

Yearly evolution

Evolution of the median price per m²

Evolution of the number of transactions

Warning, last year incomplete. Projections made based on the proportions between semesters of the previous year at the departmental/national level and by type of property.

Yearly data

Descending order
Year
Houses
house
transactions
Houses
house
Price per m²
Apartments
apt.
transactions
Apartments
apt.
Price per m²
2025
134
3 857 €
93
3 294 €
2024
281
3 673 €
231
2 922 €
2023
298
3 900 €
255
3 052 €
2022
423
3 952 €
302
3 385 €
2021
451
3 837 €
319
3 246 €
2020
348
3 630 €
268
2 910 €
2019
446
3 492 €
321
2 976 €
2018
402
3 240 €
256
2 710 €
2017
417
3 250 €
249
2 778 €
2016
328
3 058 €
236
2 748 €
2015
328
3 232 €
204
2 559 €
2014
341
3 000 €
211
2 633 €

Analysis

Structure of prices per m²

Values of price percentiles per m² over the periods used for the estimated price of each type of property.

Structure of transaction amounts

Values of transaction amounts percentiles over the periods used for the estimated price of each type of property.

Transaction amounts and prices per m² by percentile

Ascending order
Percentile
Houses
house
Price per m²
Houses
house
Transaction amount
Apartments
apt.
Price per m²
Apartments
apt.
Transaction amount
10th percentile
2 739 €
210 K€
1 729 €
85 600 €
20th percentile
3 196 €
233 K€
2 288 €
114 K€
30th percentile
3 487 €
250 K€
2 888 €
130 K€
40th percentile
3 846 €
290 K€
3 231 €
142 K€
50th percentile
4 000 €
315 K€
3 624 €
159 K€
60th percentile
4 276 €
340 K€
3 769 €
178 K€
70th percentile
4 583 €
363 K€
3 923 €
201 K€
80th percentile
5 194 €
400 K€
4 265 €
242 K€
90th percentile
6 280 €
467 K€
4 534 €
265 K€

National and departmental comparison

Evolution of the median price per m² of houses

Evolution of the median price per m² of apartments

Quarterly evolution

Evolution of the median price per m²

Evolution of the number of transactions

Quarterly data

Descending order
Quarter
Houses
house
transactions
Houses
house
Price per m²
Apartments
apt.
transactions
Apartments
apt.
Price per m²
2025 Q2
51
4 000 €
30
3 624 €
2025 Q1
83
3 797 €
63
2 857 €
2024 Q4
68
3 809 €
45
3 351 €
2024 Q3
73
3 703 €
69
3 000 €
2024 Q2
81
3 609 €
53
2 825 €
2024 Q1
59
3 806 €
64
2 652 €
2023 Q4
68
3 654 €
60
3 219 €
2023 Q3
89
4 114 €
53
2 838 €
2023 Q2
79
3 879 €
67
2 948 €
2023 Q1
62
4 234 €
75
2 981 €
2022 Q4
100
3 950 €
71
3 494 €
2022 Q3
113
3 938 €
72
3 463 €
2022 Q2
115
3 870 €
80
3 168 €
2022 Q1
95
4 159 €
79
3 379 €
2021 Q4
108
3 860 €
76
3 096 €
2021 Q3
123
3 941 €
94
3 468 €
2021 Q2
127
3 913 €
90
3 106 €
2021 Q1
93
3 718 €
59
3 232 €
2020 Q4
100
3 743 €
96
3 150 €
2020 Q3
106
3 492 €
69
2 899 €
2020 Q2
64
3 476 €
54
2 620 €
2020 Q1
78
3 667 €
49
2 597 €
2019 Q4
116
3 618 €
88
3 092 €
2019 Q3
122
3 535 €
85
2 877 €
2019 Q2
105
3 260 €
77
3 000 €
2019 Q1
103
3 571 €
71
2 895 €
2018 Q4
100
3 410 €
65
2 778 €
2018 Q3
125
3 198 €
60
2 635 €
2018 Q2
91
3 084 €
74
2 638 €
2018 Q1
86
3 313 €
57
2 615 €
2017 Q4
106
3 155 €
63
2 711 €
2017 Q3
108
3 292 €
59
2 840 €
2017 Q2
101
3 440 €
60
2 678 €
2017 Q1
102
3 235 €
67
2 813 €
2016 Q4
95
3 185 €
60
2 787 €
2016 Q3
74
3 116 €
61
2 760 €
2016 Q2
93
2 941 €
64
2 732 €
2016 Q1
66
3 087 €
51
2 679 €
2015 Q4
82
3 350 €
55
2 712 €
2015 Q3
97
3 182 €
55
2 534 €
2015 Q2
69
3 067 €
55
2 422 €
2015 Q1
80
3 064 €
39
2 500 €
2014 Q4
82
2 950 €
49
2 542 €
2014 Q3
86
2 858 €
53
2 745 €
2014 Q2
75
3 125 €
53
2 662 €
2014 Q1
98
3 080 €
56
2 461 €

Seine-Saint-Denis (93)

Most expensive cities

City
name
Descending orderHouses
house
Price per m²
7 833 €
7 653 €
6 759 €
6 673 €
6 636 €
6 158 €
5 326 €
4 828 €
4 688 €
4 611 €
City
name
Descending orderApartments
apt.
Price per m²
6 433 €
6 220 €
5 674 €
5 478 €
5 347 €
5 280 €
5 127 €
4 450 €
4 298 €
4 154 €

Least expensive cities

City
name
Ascending orderHouses
house
Price per m²
2 918 €
2 949 €
3 015 €
3 072 €
3 107 €
3 165 €
3 267 €
3 288 €
3 301 €
3 311 €
City
name
Ascending orderApartments
apt.
Price per m²
1 836 €
2 259 €
2 580 €
2 606 €
2 640 €
2 691 €
2 787 €
2 860 €
2 878 €
2 903 €