emooki
HomePrice mapTransactions
🇬🇧 English🇫🇷 Français🇩🇪 Deutsch🇪🇸 Español🇮🇹 Italiano

Real estate price map


Real estate price map in the municipality of Villemomble, choose a section to see transactions by parcel.

Seine-Saint-Denis (93)
Villemomble

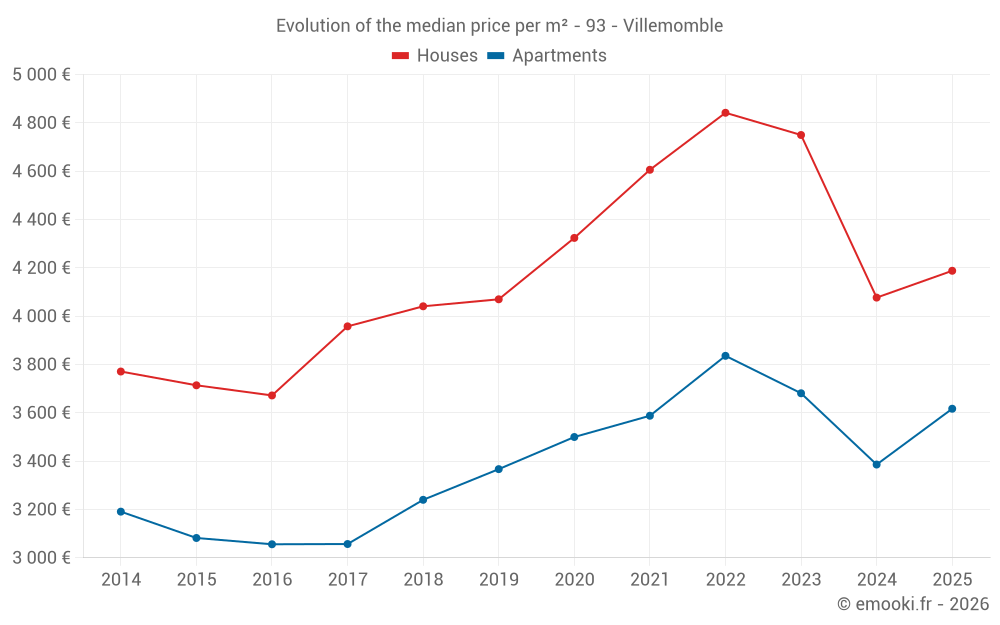
Median price of real estate
in the municipality of Villemomble

HousesHouses
4 688 € /m²
1-23-45-67-89-10
Reliability 10/10
Median price on the 31 transactions of the last 3 months.
from 3 356 to
5 524 € /m²
60% of transactions from the 2nd to the 8th deciles.
ApartmentsApartments
3 617 € /m²
1-23-45-67-89-10
Reliability 9/10
Median price on the 59 transactions of the last 6 months.
from 2 859 to
4 156 € /m²
60% of transactions from the 2nd to the 8th deciles.
DwellingsDwellings
4 146 € /m²
1-23-45-67-89-10
Reliability 10/10
Median price on the 50 transactions of the last 3 months.
from 3 034 to
5 087 € /m²
60% of transactions from the 2nd to the 8th deciles.
HousesEvolution of the price per m² of houses since...
1 year
+2.7%
2 years
-12%
3 years
-14%
4 years
-9.1%
5 years
-3.1%
6 years
+2.9%
7 years
+3.6%
8 years
+5.8%
9 years
+14%
10 years
+13%
11 years
+11%
The price per m² of houses has decreased by 14% since 3 years, but it has increased by 14% in 9 years.
ApartmentsEvolution of the price per m² of apartments since...
1 year
+6.8%
2 years
-1.7%
3 years
-5.7%
4 years
+0.8%
5 years
+3.3%
6 years
+7.4%
7 years
+12%
8 years
+18%
9 years
+18%
10 years
+17%
11 years
+13%
The price per m² of apartments has decreased by 5.7% since 3 years, but it has increased by 18% in 9 years.

Yearly evolution

Evolution of the median price per m²

Evolution of the number of transactions

Warning, last year incomplete. Projections made based on the proportions between semesters of the previous year at the departmental/national level and by type of property.

Yearly data

Descending order
Year
Houses
house
transactions
Houses
house
Price per m²
Apartments
apt.
transactions
Apartments
apt.
Price per m²
2025
57
4 188 €
59
3 617 €
2024
113
4 077 €
158
3 386 €
2023
141
4 750 €
196
3 681 €
2022
199
4 842 €
249
3 836 €
2021
213
4 606 €
250
3 588 €
2020
184
4 324 €
231
3 500 €
2019
185
4 070 €
257
3 367 €
2018
185
4 041 €
234
3 240 €
2017
187
3 958 €
235
3 057 €
2016
170
3 672 €
203
3 056 €
2015
185
3 714 €
176
3 082 €
2014
129
3 771 €
175
3 191 €

Analysis

Structure of prices per m²

Values of price percentiles per m² over the periods used for the estimated price of each type of property.

Structure of transaction amounts

Values of transaction amounts percentiles over the periods used for the estimated price of each type of property.

Transaction amounts and prices per m² by percentile

Ascending order
Percentile
Houses
house
Price per m²
Houses
house
Transaction amount
Apartments
apt.
Price per m²
Apartments
apt.
Transaction amount
10th percentile
2 940 €
285 K€
2 253 €
90 400 €
20th percentile
3 356 €
319 K€
2 859 €
118 K€
30th percentile
3 654 €
335 K€
3 135 €
127 K€
40th percentile
4 159 €
350 K€
3 430 €
140 K€
50th percentile
4 688 €
405 K€
3 617 €
152 K€
60th percentile
4 819 €
431 K€
3 756 €
173 K€
70th percentile
5 145 €
470 K€
3 923 €
207 K€
80th percentile
5 524 €
486 K€
4 156 €
244 K€
90th percentile
5 923 €
490 K€
4 446 €
311 K€

National and departmental comparison

Evolution of the median price per m² of houses

Evolution of the median price per m² of apartments

Quarterly evolution

Evolution of the median price per m²

Evolution of the number of transactions

Quarterly data

Descending order
Quarter
Houses
house
transactions
Houses
house
Price per m²
Apartments
apt.
transactions
Apartments
apt.
Price per m²
2025 Q2
31
4 688 €
19
3 739 €
2025 Q1
26
4 084 €
40
3 524 €
2024 Q4
30
3 764 €
49
3 328 €
2024 Q3
33
4 727 €
37
3 576 €
2024 Q2
29
3 803 €
37
3 469 €
2024 Q1
21
4 077 €
35
3 348 €
2023 Q4
35
4 710 €
42
3 764 €
2023 Q3
40
4 341 €
46
3 693 €
2023 Q2
36
4 877 €
63
3 651 €
2023 Q1
30
5 058 €
45
3 571 €
2022 Q4
37
4 861 €
60
3 816 €
2022 Q3
63
5 086 €
79
3 901 €
2022 Q2
66
4 767 €
61
3 667 €
2022 Q1
33
4 733 €
49
3 770 €
2021 Q4
49
4 386 €
67
3 659 €
2021 Q3
70
4 659 €
70
3 576 €
2021 Q2
52
4 912 €
67
3 708 €
2021 Q1
42
4 506 €
46
3 470 €
2020 Q4
54
4 488 €
56
3 830 €
2020 Q3
48
4 626 €
52
3 328 €
2020 Q2
30
3 722 €
63
3 404 €
2020 Q1
52
4 030 €
60
3 372 €
2019 Q4
47
3 952 €
53
3 714 €
2019 Q3
63
4 338 €
62
3 093 €
2019 Q2
38
4 268 €
80
3 281 €
2019 Q1
37
4 020 €
62
3 274 €
2018 Q4
46
4 156 €
61
3 264 €
2018 Q3
48
4 187 €
63
2 967 €
2018 Q2
50
4 176 €
55
3 382 €
2018 Q1
41
3 754 €
55
3 243 €
2017 Q4
31
3 958 €
48
3 040 €
2017 Q3
58
3 877 €
52
3 230 €
2017 Q2
52
3 726 €
83
2 960 €
2017 Q1
46
4 107 €
52
3 164 €
2016 Q4
36
3 494 €
53
3 098 €
2016 Q3
62
3 874 €
48
3 100 €
2016 Q2
45
3 613 €
53
3 000 €
2016 Q1
27
3 455 €
49
3 043 €
2015 Q4
43
3 671 €
43
3 107 €
2015 Q3
67
3 875 €
53
2 857 €
2015 Q2
48
3 360 €
47
3 091 €
2015 Q1
27
3 778 €
33
3 308 €
2014 Q4
24
3 772 €
36
2 876 €
2014 Q3
45
3 608 €
54
3 504 €
2014 Q2
30
4 206 €
46
3 042 €
2014 Q1
30
3 820 €
39
3 191 €

Overview of the latest real estate transactions

The following list is an anonymized overview of the latest transactions. For more details and to find all transactions, please use the map to view transactions by plot or the transaction search page for a search by criteria.

2025-06-30
420 000 €
4 884 € /m²(86 m²)
Sale
Houses
House
5 rooms
86 m2
Land
300 m2
-Sols
Land
594 m2
-Terrains d'agrément
2025-06-27
42 000 €
Sale
2 outbuildings
2025-06-27
349 600 €
4 789 € /m²(73 m²)
Sale
Houses
House
3 rooms
73 m2
Land
429 m2
-Sols
2025-06-26
146 500 €
1 422 € /m²(103 m²)
Sale
Apartments
Apartment
2 rooms
46 m2
Apartments
Apartment
3 rooms
57 m2
1 outbuilding
2025-06-25
80 000 €
2 963 € /m²(27 m²)
Sale
Apartments
Apartment
2 rooms
27 m2
2025-06-25
367 500 €
2 940 € /m²(125 m²)
Sale
Houses
House
6 rooms
125 m2
1 outbuilding
Land
330 m2
-Sols
2025-06-20
120 000 €
3 871 € /m²(31 m²)
Sale
1 outbuilding
Apartments
Apartment
1 room
31 m2
1 outbuilding
1 outbuilding
2025-06-20
486 375 €
4 588 € /m²(106 m²)
Sale
Houses
House
6 rooms
106 m2
Land
615 m2
-Sols
2025-06-19
290 000 €
1 330 € /m²(218 m²)
3 625 € /m²(80 m²)
Sale
Houses
House
3 rooms
80 m2
Commercial property
138 m2
Land
677 m2
-Sols
2025-06-17
119 000 €
4 577 € /m²(26 m²)
Sale
Apartments
Apartment
2 rooms
26 m2
2025-06-17
436 050 €
5 814 € /m²(75 m²)
Sale
Houses
House
4 rooms
75 m2
Land
227 m2
-Sols
2025-06-16
11 500 €
Sale
1 outbuilding
2025-06-16
295 000 €
5 463 € /m²(54 m²)
Sale
Houses
House
3 rooms
54 m2
1 outbuilding
Land
158 m2
-Sols
2025-06-16
7 000 €
119 € /m²(59 m²)
Sale
Commercial property
59 m2
2025-06-13
309 000 €
4 176 € /m²(74 m²)
Sale
Apartments
Apartment
3 rooms
74 m2
1 outbuilding
2025-06-13
275 000 €
4 741 € /m²(58 m²)
Sale
Houses
House
4 rooms
58 m2
Land
191 m2
-Sols
2025-06-11
17 000 €
Sale
1 outbuilding
2025-06-11
230 000 €
3 433 € /m²(67 m²)
Sale
Apartments
Apartment
3 rooms
67 m2
3 outbuildings
2025-06-11
319 000 €
5 145 € /m²(62 m²)
Sale
Houses
House
4 rooms
62 m2
2025-06-10
340 000 €
3 542 € /m²(96 m²)
Sale
Houses
House
4 rooms
96 m2
Land
184 m2
-Sols
5656 transactions listed in the municipality

Seine-Saint-Denis (93)

Most expensive cities

City
name
Descending orderHouses
house
Price per m²
7 833 €
7 653 €
6 759 €
6 673 €
6 636 €
6 158 €
5 326 €
4 828 €
4 688 €
4 611 €
City
name
Descending orderApartments
apt.
Price per m²
6 433 €
6 220 €
5 674 €
5 478 €
5 347 €
5 280 €
5 127 €
4 450 €
4 298 €
4 154 €

Least expensive cities

City
name
Ascending orderHouses
house
Price per m²
2 918 €
2 949 €
3 015 €
3 072 €
3 107 €
3 165 €
3 267 €
3 288 €
3 301 €
3 311 €
City
name
Ascending orderApartments
apt.
Price per m²
1 836 €
2 259 €
2 580 €
2 606 €
2 640 €
2 691 €
2 787 €
2 860 €
2 878 €
2 903 €