emooki
HomePrice mapTransactions
🇬🇧 English🇫🇷 Français🇩🇪 Deutsch🇪🇸 Español🇮🇹 Italiano

Real estate price map


Real estate price map in the municipality of Le Plessis-Trévise, choose a section to see transactions by parcel.

Val-de-Marne (94)
Le Plessis-Trévise

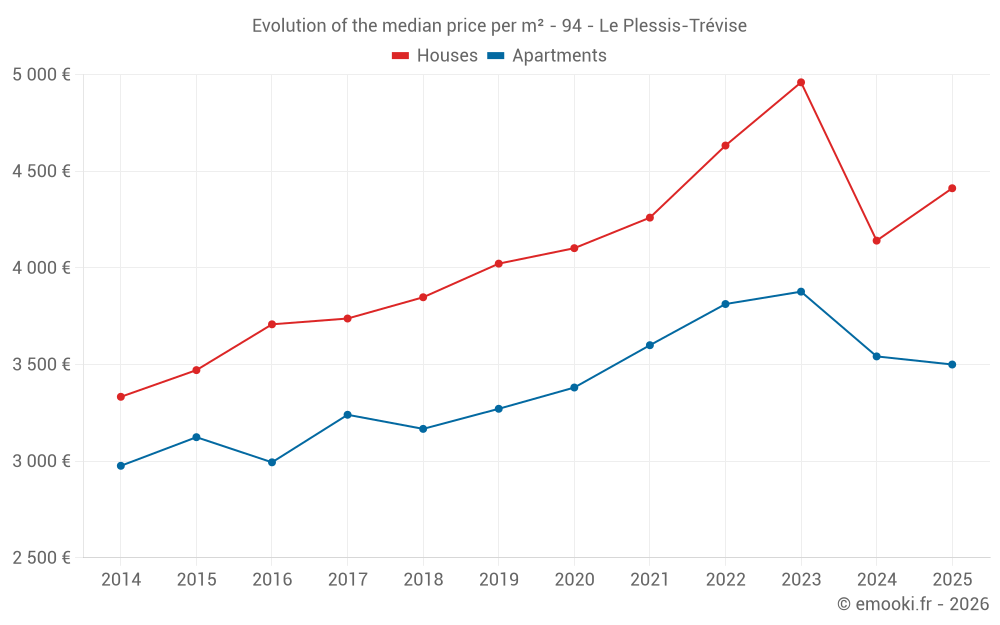
Median price of real estate
in the municipality of Le Plessis-Trévise

HousesHouses
4 424  /m²
1-23-45-67-89-10
Reliability 8/10
Median price on the 42 transactions of the last 12 months.
from 3 388 to
5 161  /m²
60% of transactions from the 2nd to the 8th deciles.
ApartmentsApartments
2 794  /m²
1-23-45-67-89-10
Reliability 10/10
Median price on the 25 transactions of the last 3 months.
from 2 451 to
3 884  /m²
60% of transactions from the 2nd to the 8th deciles.
DwellingsDwellings
2 870  /m²
1-23-45-67-89-10
Reliability 10/10
Median price on the 30 transactions of the last 3 months.
from 2 458 to
4 366  /m²
60% of transactions from the 2nd to the 8th deciles.
HousesEvolution of the price per m² of houses since...
1 year
+6.5%
2 years
-11%
3 years
-4.8%
4 years
+3.6%
5 years
+7.6%
6 years
+10%
7 years
+15%
8 years
+18%
9 years
+19%
10 years
+27%
11 years
+32%
The price per m² of houses has decreased by 11% since 2 years, but it has increased by 32% in 11 years.
ApartmentsEvolution of the price per m² of apartments since...
1 year
-1.2%
2 years
-10%
3 years
-8.2%
4 years
-2.8%
5 years
+3.5%
6 years
+7%
7 years
+11%
8 years
+8%
9 years
+17%
10 years
+12%
11 years
+18%
The price per m² of apartments has decreased by 10% since 2 years, but it has increased by 18% in 11 years.

Yearly evolution

Evolution of the median price per m²

Evolution of the number of transactions

Warning, last year incomplete. Projections made based on the proportions between semesters of the previous year at the departmental/national level and by type of property.

Yearly data

Descending order
Year
Houses
house
transactions
Houses
house
Price per m²
Apartments
apt.
transactions
Apartments
apt.
Price per m²
2025
12
4 412 
59
3 500 
2024
49
4 141 
139
3 542 
2023
42
4 960 
158
3 877 
2022
89
4 633 
206
3 813 
2021
75
4 260 
234
3 600 
2020
80
4 102 
231
3 381 
2019
109
4 022 
231
3 271 
2018
66
3 848 
205
3 167 
2017
76
3 738 
212
3 240 
2016
74
3 708 
204
2 994 
2015
63
3 471 
196
3 124 
2014
71
3 333 
180
2 976 

Analysis

Structure of prices per m²

Values of price percentiles per m² over the periods used for the estimated price of each type of property.

Structure of transaction amounts

Values of transaction amounts percentiles over the periods used for the estimated price of each type of property.

Transaction amounts and prices per m² by percentile

Ascending order
Percentile
Houses
house
Price per m²
Houses
house
Transaction amount
Apartments
apt.
Price per m²
Apartments
apt.
Transaction amount
10th percentile
3 125 
335 K
2 406 
145 K
20th percentile
3 388 
351 K
2 451 
149 K
30th percentile
3 763 
369 K
2 587 
160 K
40th percentile
3 967 
383 K
2 673 
167 K
50th percentile
4 424 
430 K
2 794 
180 K
60th percentile
4 599 
462 K
2 919 
198 K
70th percentile
4 968 
496 K
3 360 
220 K
80th percentile
5 161 
530 K
3 884 
262 K
90th percentile
6 188 
633 K
4 375 
285 K

National and departmental comparison

Evolution of the median price per m² of houses

Evolution of the median price per m² of apartments

Quarterly evolution

Evolution of the median price per m²

Evolution of the number of transactions

Quarterly data

Descending order
Quarter
Houses
house
transactions
Houses
house
Price per m²
Apartments
apt.
transactions
Apartments
apt.
Price per m²
2025 Q2
5
4 619 
25
2 794 
2025 Q1
7
4 205 
34
3 985 
2024 Q4
14
4 436 
29
3 903 
2024 Q3
16
4 288 
41
3 710 
2024 Q2
10
3 464 
39
3 572 
2024 Q1
9
3 829 
30
3 244 
2023 Q4
7
5 130 
34
3 654 
2023 Q3
13
4 762 
46
4 059 
2023 Q2
13
4 638 
47
3 817 
2023 Q1
9
5 130 
31
3 969 
2022 Q4
20
5 376 
55
3 926 
2022 Q3
33
4 594 
52
3 762 
2022 Q2
26
4 452 
59
3 700 
2022 Q1
10
4 289 
40
3 903 
2021 Q4
19
4 364 
54
3 470 
2021 Q3
24
4 157 
68
3 765 
2021 Q2
18
3 978 
64
3 494 
2021 Q1
14
4 137 
48
3 676 
2020 Q4
24
4 635 
68
3 601 
2020 Q3
24
4 038 
60
3 214 
2020 Q2
15
4 133 
50
3 415 
2020 Q1
17
3 784 
53
3 305 
2019 Q4
28
3 998 
60
3 336 
2019 Q3
43
4 442 
54
3 524 
2019 Q2
17
4 022 
61
3 271 
2019 Q1
21
3 861 
56
2 976 
2018 Q4
13
3 845 
52
3 090 
2018 Q3
24
3 680 
63
3 049 
2018 Q2
17
4 038 
48
3 175 
2018 Q1
12
4 115 
42
3 304 
2017 Q4
17
3 915 
45
3 500 
2017 Q3
28
3 764 
65
3 394 
2017 Q2
13
3 709 
56
3 064 
2017 Q1
18
3 432 
46
2 998 
2016 Q4
12
3 300 
49
2 966 
2016 Q3
25
3 792 
58
2 914 
2016 Q2
17
3 790 
48
2 934 
2016 Q1
20
3 609 
49
3 161 
2015 Q4
17
3 667 
42
3 440 
2015 Q3
17
4 125 
75
3 064 
2015 Q2
13
3 370 
37
3 032 
2015 Q1
16
3 296 
42
3 259 
2014 Q4
22
3 396 
41
3 000 
2014 Q3
22
3 230 
55
2 927 
2014 Q2
15
3 206 
43
2 914 
2014 Q1
12
3 366 
41
3 055 

Overview of the latest real estate transactions

The following list is an anonymized overview of the latest transactions. For more details and to find all transactions, please use the map to view transactions by plot or the transaction search page for a search by criteria.

2025-06-13
102 500 
3 306  /m²(31 m²)
Sale
1 outbuilding
Apartments
Apartment
1 room
31 m2
2025-06-12
145 000 
2 589  /m²(56 m²)
Sale
Apartments
Apartment
3 rooms
56 m2
2 outbuildings
2025-06-11
128 000 
4 414  /m²(29 m²)
Sale
Apartments
Apartment
1 room
29 m2
1 outbuilding
2025-06-10
272 500 
4 619  /m²(59 m²)
Sale
Houses
House
4 rooms
59 m2
Land
444 m2
-Sols
2025-06-10
314 000 
4 361  /m²(72 m²)
Sale
Apartments
Apartment
3 rooms
72 m2
2 outbuildings
2025-06-05
162 000 
2 945  /m²(55 m²)
Sale
Apartments
Apartment
2 rooms
55 m2
2 outbuildings
2025-06-03
2 584 590 
Sale
2025-06-02
635 000 
3 470  /m²(183 m²)
Sale
Houses
House
7 rooms
183 m2
Land
531 m2
-Sols
2025-05-28
25 000 
255  /m²(98 m²)
Sale
Commercial property
98 m2
2025-05-26
950 000 
2 879  /m²(330 m²)
7 600  /m²(125 m²)
Sale
Land
97 m2
-Sols
Houses
House
6 rooms
125 m2
Commercial property
205 m2
1 outbuilding
Land
347 m2
-Sols
Land
2397 m2
-Jardins
/Jardin potager
2025-05-23
170 000 
2 787  /m²(61 m²)
Sale
Commercial property
61 m2
2025-05-21
180 000 
3 600  /m²(50 m²)
Sale
Commercial property
50 m2
2025-05-19
312 240 
3 762  /m²(83 m²)
Sale
Apartments
Apartment
3 rooms
83 m2
2 outbuildings
2025-05-14
369 000 
4 920  /m²(75 m²)
Sale
Houses
House
4 rooms
75 m2
Land
478 m2
-Sols
2025-05-12
194 000 
2 395  /m²(81 m²)
Sale
Apartments
Apartment
4 rooms
81 m2
1 outbuilding
1 outbuilding
2025-05-06
7 900 
Sale
1 outbuilding
2025-04-30
280 000 
3 373  /m²(83 m²)
Sale
Apartments
Apartment
4 rooms
83 m2
1 outbuilding
2025-04-30
205 000 
4 271  /m²(48 m²)
Sale
Apartments
Apartment
2 rooms
48 m2
1 outbuilding
2025-04-30
425 000 
Sale
Land
1231 m2
-Sols
Land
727 m2
-Sols
2025-04-30
180 000 
2 195  /m²(82 m²)
Sale
Apartments
Apartment
3 rooms
82 m2
3 outbuildings
4018 transactions listed in the municipality

Val-de-Marne (94)

Most expensive cities

City
name
Descending orderHouses
house
Price per m²
11 952 
11 467 
8 514 
8 109 
6 752 
City
name
Descending orderApartments
apt.
Price per m²
8 716 
8 516 
5 909 
5 689 
5 638 

Least expensive cities

City
name
Ascending orderHouses
house
Price per m²
3 305 
3 308 
3 358 
3 417 
3 731 
City
name
Ascending orderApartments
apt.
Price per m²
2 916 
3 054 
3 182 
3 203 
3 293