emooki
HomePrice mapTransactions
🇬🇧 English🇫🇷 Français🇩🇪 Deutsch🇪🇸 Español🇮🇹 Italiano

Real estate price map


Real estate price map in the municipality of Pontault-Combault.

Seine-et-Marne (77)
Pontault-Combault

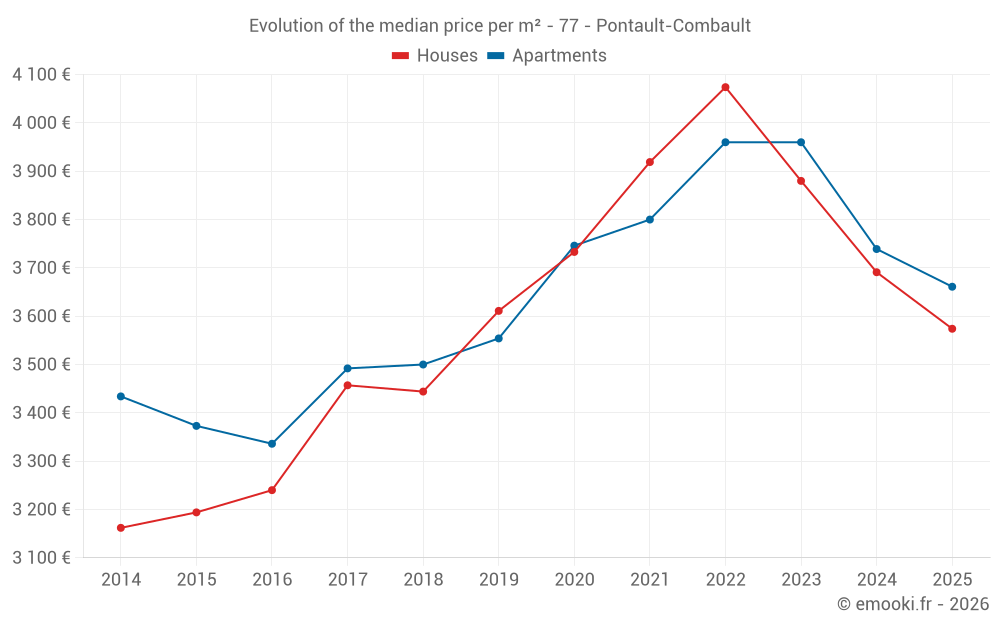
Median price of real estate
in the municipality of Pontault-Combault

HousesHouses
3 578 € /m²
1-23-45-67-89-10
Reliability 10/10
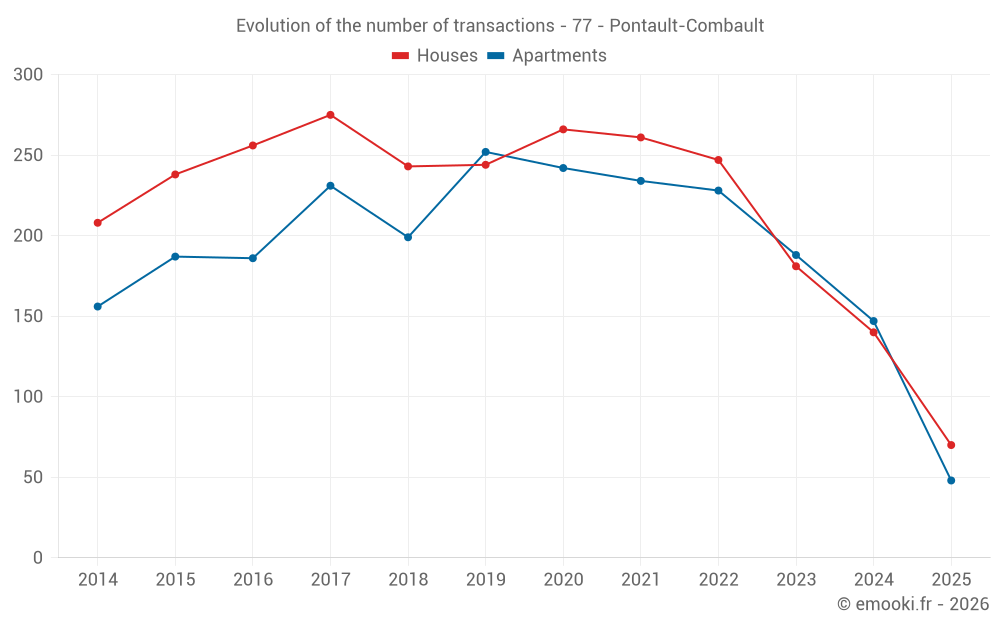
Median price on the 26 transactions of the last 3 months.
from 3 109 to
4 023 € /m²
60% of transactions from the 2nd to the 8th deciles.
ApartmentsApartments
3 661 € /m²
1-23-45-67-89-10
Reliability 9/10
Median price on the 48 transactions of the last 6 months.
from 3 115 to
4 196 € /m²
60% of transactions from the 2nd to the 8th deciles.
DwellingsDwellings
3 578 € /m²
1-23-45-67-89-10
Reliability 10/10
Median price on the 44 transactions of the last 3 months.
from 2 959 to
3 960 € /m²
60% of transactions from the 2nd to the 8th deciles.
HousesEvolution of the price per m² of houses since...
1 year
-3.2%
2 years
-7.9%
3 years
-12%
4 years
-8.8%
5 years
-4.3%
6 years
-1%
7 years
+3.8%
8 years
+3.4%
9 years
+10%
10 years
+12%
11 years
+13%
ApartmentsEvolution of the price per m² of apartments since...
1 year
-2.1%
2 years
-7.6%
3 years
-7.6%
4 years
-3.7%
5 years
-2.3%
6 years
+3%
7 years
+4.6%
8 years
+4.8%
9 years
+10%
10 years
+8.5%
11 years
+6.6%

Yearly evolution

Evolution of the median price per m²

Evolution of the number of transactions

Warning, last year incomplete. Projections made based on the proportions between semesters of the previous year at the departmental/national level and by type of property.

Yearly data

Descending order
Year
Houses
house
transactions
Houses
house
Price per m²
Apartments
apt.
transactions
Apartments
apt.
Price per m²
2025
70
3 574 €
48
3 661 €
2024
140
3 691 €
147
3 739 €
2023
181
3 880 €
188
3 960 €
2022
247
4 074 €
228
3 960 €
2021
261
3 919 €
234
3 800 €
2020
266
3 733 €
242
3 746 €
2019
244
3 611 €
252
3 554 €
2018
243
3 444 €
199
3 500 €
2017
275
3 457 €
231
3 492 €
2016
256
3 240 €
186
3 336 €
2015
238
3 194 €
187
3 373 €
2014
208
3 162 €
156
3 434 €

Analysis

Structure of prices per m²

Values of price percentiles per m² over the periods used for the estimated price of each type of property.

Structure of transaction amounts

Values of transaction amounts percentiles over the periods used for the estimated price of each type of property.

Transaction amounts and prices per m² by percentile

Ascending order
Percentile
Houses
house
Price per m²
Houses
house
Transaction amount
Apartments
apt.
Price per m²
Apartments
apt.
Transaction amount
10th percentile
2 817 €
288 K€
2 806 €
129 K€
20th percentile
3 109 €
300 K€
3 115 €
150 K€
30th percentile
3 332 €
331 K€
3 336 €
165 K€
40th percentile
3 480 €
336 K€
3 517 €
178 K€
50th percentile
3 578 €
348 K€
3 661 €
188 K€
60th percentile
3 620 €
354 K€
3 893 €
197 K€
70th percentile
3 844 €
378 K€
4 122 €
210 K€
80th percentile
4 023 €
417 K€
4 196 €
218 K€
90th percentile
4 192 €
440 K€
4 373 €
245 K€

National and departmental comparison

Evolution of the median price per m² of houses

Evolution of the median price per m² of apartments

Quarterly evolution

Evolution of the median price per m²

Evolution of the number of transactions

Quarterly data

Descending order
Quarter
Houses
house
transactions
Houses
house
Price per m²
Apartments
apt.
transactions
Apartments
apt.
Price per m²
2025 Q2
26
3 578 €
18
3 522 €
2025 Q1
44
3 555 €
30
3 949 €
2024 Q4
34
3 422 €
42
3 887 €
2024 Q3
44
3 516 €
33
3 750 €
2024 Q2
30
3 816 €
41
3 542 €
2024 Q1
32
3 852 €
31
3 967 €
2023 Q4
29
3 876 €
42
3 677 €
2023 Q3
60
3 766 €
59
3 926 €
2023 Q2
43
4 038 €
37
4 000 €
2023 Q1
49
3 862 €
50
4 040 €
2022 Q4
45
4 031 €
59
4 072 €
2022 Q3
83
4 117 €
54
3 950 €
2022 Q2
56
4 118 €
51
4 015 €
2022 Q1
63
4 050 €
64
3 868 €
2021 Q4
57
4 000 €
47
3 833 €
2021 Q3
86
3 995 €
71
3 804 €
2021 Q2
69
3 647 €
66
3 778 €
2021 Q1
49
3 919 €
50
3 744 €
2020 Q4
66
3 781 €
66
3 805 €
2020 Q3
87
3 733 €
63
3 788 €
2020 Q2
58
3 796 €
56
3 596 €
2020 Q1
55
3 659 €
57
3 612 €
2019 Q4
55
3 594 €
77
3 556 €
2019 Q3
75
3 718 €
59
3 462 €
2019 Q2
61
3 503 €
58
3 504 €
2019 Q1
53
3 453 €
58
3 644 €
2018 Q4
47
3 404 €
45
3 532 €
2018 Q3
93
3 529 €
74
3 506 €
2018 Q2
56
3 360 €
38
3 407 €
2018 Q1
47
3 500 €
42
3 592 €
2017 Q4
58
3 608 €
47
3 295 €
2017 Q3
76
3 557 €
54
3 540 €
2017 Q2
74
3 378 €
76
3 506 €
2017 Q1
67
3 368 €
54
3 311 €
2016 Q4
64
3 211 €
40
3 314 €
2016 Q3
75
3 224 €
43
3 440 €
2016 Q2
66
3 366 €
53
3 258 €
2016 Q1
51
3 126 €
50
3 364 €
2015 Q4
69
3 092 €
43
3 244 €
2015 Q3
62
3 225 €
61
3 292 €
2015 Q2
53
3 250 €
41
3 571 €
2015 Q1
54
3 220 €
42
3 443 €
2014 Q4
40
3 223 €
32
3 382 €
2014 Q3
56
3 132 €
47
3 442 €
2014 Q2
67
3 206 €
33
3 469 €
2014 Q1
45
3 131 €
44
3 497 €

Seine-et-Marne (77)

Most expensive cities

City
name
Descending orderHouses
house
Price per m²
5 573 €
4 928 €
4 680 €
4 674 €
4 590 €
4 436 €
4 363 €
4 277 €
4 214 €
4 098 €
City
name
Descending orderApartments
apt.
Price per m²
64 397 €
10 818 €
6 944 €
4 800 €
4 649 €
4 625 €
4 584 €
4 574 €
4 448 €
4 430 €

Least expensive cities

City
name
Ascending orderHouses
house
Price per m²
1 052 €
1 176 €
1 280 €
1 330 €
1 338 €
1 341 €
1 345 €
1 348 €
1 406 €
1 406 €
City
name
Ascending orderApartments
apt.
Price per m²
193 €
466 €
478 €
552 €
580 €
675 €
682 €
685 €
724 €
725 €