emooki
HomePrice mapTransactions
🇬🇧 English🇫🇷 Français🇩🇪 Deutsch🇪🇸 Español🇮🇹 Italiano

Real estate price map


Real estate price map in the municipality of Émerainville.

Seine-et-Marne (77)
Émerainville

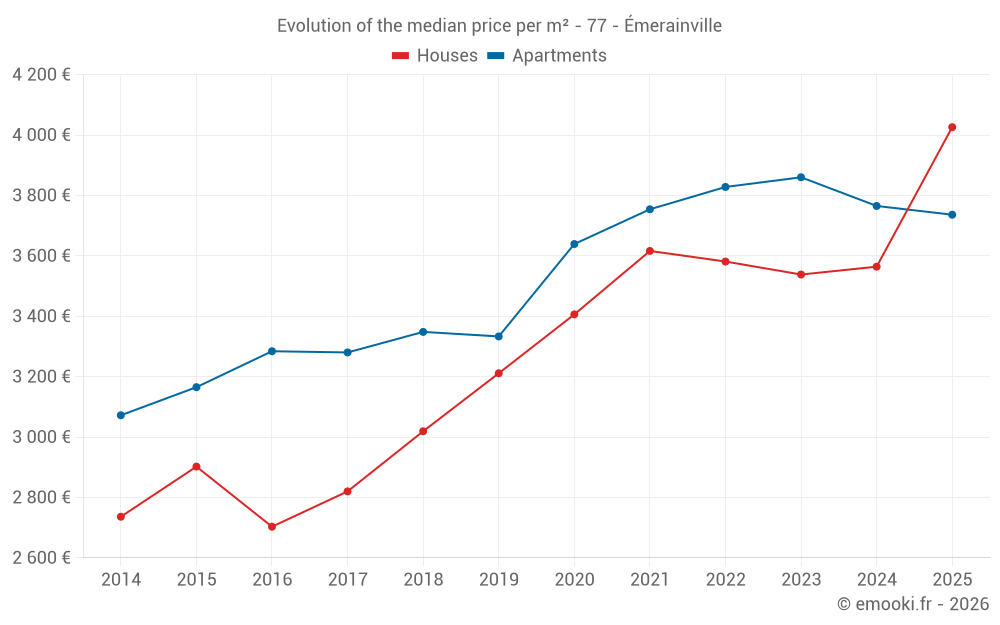
Median price of real estate
in the municipality of Émerainville

HousesHouses
3 939  /m²
1-23-45-67-89-10
Reliability 8/10
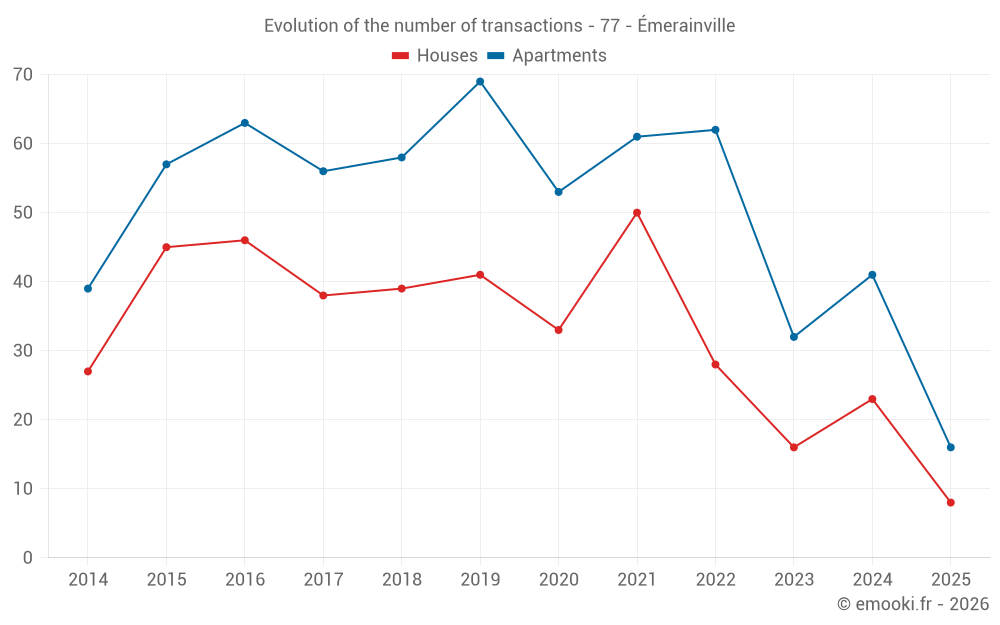
Median price on the 20 transactions of the last 12 months.
from 2 720 to
4 429  /m²
60% of transactions from the 2nd to the 8th deciles.
ApartmentsApartments
3 809  /m²
1-23-45-67-89-10
Reliability 8/10
Median price on the 39 transactions of the last 12 months.
from 3 497 to
4 033  /m²
60% of transactions from the 2nd to the 8th deciles.
DwellingsDwellings
3 776  /m²
1-23-45-67-89-10
Reliability 9/10
Median price on the 24 transactions of the last 6 months.
from 3 343 to
4 288  /m²
60% of transactions from the 2nd to the 8th deciles.
HousesEvolution of the price per m² of houses since...
1 year
+13%
2 years
+14%
3 years
+12%
4 years
+11%
5 years
+18%
6 years
+25%
7 years
+33%
8 years
+43%
9 years
+49%
10 years
+39%
11 years
+47%
ApartmentsEvolution of the price per m² of apartments since...
1 year
-0.8%
2 years
-3.2%
3 years
-2.4%
4 years
-0.5%
5 years
+2.7%
6 years
+12%
7 years
+12%
8 years
+14%
9 years
+14%
10 years
+18%
11 years
+22%

Yearly evolution

Evolution of the median price per m²

Evolution of the number of transactions

Warning, last year incomplete. Projections made based on the proportions between semesters of the previous year at the departmental/national level and by type of property.

Yearly data

Descending order
Year
Houses
house
transactions
Houses
house
Price per m²
Apartments
apt.
transactions
Apartments
apt.
Price per m²
2025
8
4 026 
16
3 736 
2024
23
3 564 
41
3 765 
2023
16
3 538 
32
3 860 
2022
28
3 581 
62
3 828 
2021
50
3 616 
61
3 754 
2020
33
3 406 
53
3 639 
2019
41
3 211 
69
3 333 
2018
39
3 019 
58
3 348 
2017
38
2 820 
56
3 280 
2016
46
2 703 
63
3 284 
2015
45
2 902 
57
3 165 
2014
27
2 736 
39
3 072 

Analysis

Structure of prices per m²

Values of price percentiles per m² over the periods used for the estimated price of each type of property.

Structure of transaction amounts

Values of transaction amounts percentiles over the periods used for the estimated price of each type of property.

Transaction amounts and prices per m² by percentile

Ascending order
Percentile
Houses
house
Price per m²
Houses
house
Transaction amount
Apartments
apt.
Price per m²
Apartments
apt.
Transaction amount
10th percentile
2 617 
263 K
3 318 
150 K
20th percentile
2 720 
314 K
3 497 
162 K
30th percentile
3 356 
334 K
3 604 
190 K
40th percentile
3 577 
346 K
3 729 
203 K
50th percentile
3 939 
360 K
3 809 
220 K
60th percentile
4 213 
369 K
3 898 
248 K
70th percentile
4 319 
379 K
3 919 
255 K
80th percentile
4 429 
397 K
4 033 
270 K
90th percentile
4 834 
665 K
4 501 
318 K

National and departmental comparison

Evolution of the median price per m² of houses

Evolution of the median price per m² of apartments

Quarterly evolution

Evolution of the median price per m²

Evolution of the number of transactions

Quarterly data

Descending order
Quarter
Houses
house
transactions
Houses
house
Price per m²
Apartments
apt.
transactions
Apartments
apt.
Price per m²
2025 Q2
5
4 244 
6
3 697 
2025 Q1
3
3 808 
10
3 736 
2024 Q4
6
3 790 
12
3 901 
2024 Q3
6
3 907 
11
3 643 
2024 Q2
7
3 238 
10
3 653 
2024 Q1
4
3 710 
8
3 874 
2023 Q4
5
3 183 
4
3 800 
2023 Q3
1
3 556 
6
4 218 
2023 Q2
6
3 554 
16
3 881 
2023 Q1
4
4 050 
6
3 323 
2022 Q4
4
4 513 
11
4 066 
2022 Q3
9
3 601 
21
3 945 
2022 Q2
6
3 176 
16
3 716 
2022 Q1
9
3 462 
14
2 984 
2021 Q4
13
3 506 
13
3 564 
2021 Q3
18
3 706 
23
3 736 
2021 Q2
10
3 596 
13
4 044 
2021 Q1
9
3 605 
12
3 854 
2020 Q4
11
3 490 
17
3 735 
2020 Q3
8
3 194 
19
3 778 
2020 Q2
6
3 248 
9
3 560 
2020 Q1
8
3 488 
8
3 266 
2019 Q4
13
3 242 
18
3 348 
2019 Q3
12
3 296 
24
3 216 
2019 Q2
8
2 860 
10
3 308 
2019 Q1
8
3 055 
17
3 431 
2018 Q4
11
3 010 
16
3 284 
2018 Q3
14
3 018 
14
3 432 
2018 Q2
6
3 366 
15
3 521 
2018 Q1
8
2 702 
13
3 270 
2017 Q4
4
3 059 
17
3 554 
2017 Q3
14
2 884 
11
3 139 
2017 Q2
10
2 749 
8
3 280 
2017 Q1
10
2 694 
20
2 839 
2016 Q4
13
2 809 
21
3 343 
2016 Q3
19
2 723 
16
3 157 
2016 Q2
8
2 838 
11
3 400 
2016 Q1
6
2 584 
15
3 172 
2015 Q4
18
2 768 
16
3 115 
2015 Q3
13
2 823 
18
3 146 
2015 Q2
7
3 299 
6
3 482 
2015 Q1
7
2 950 
17
3 204 
2014 Q4
7
2 710 
7
2 917 
2014 Q3
7
2 497 
10
3 045 
2014 Q2
10
2 792 
10
3 254 
2014 Q1
3
2 820 
12
3 188 

Seine-et-Marne (77)

Most expensive cities

City
name
Descending orderHouses
house
Price per m²
5 573 
4 928 
4 680 
4 436 
4 277 
4 214 
4 098 
City
name
Descending orderApartments
apt.
Price per m²
64 397 
10 818 
4 800 
4 625 
4 584 
4 574 
4 430 

Least expensive cities

City
name
Ascending orderHouses
house
Price per m²
1 052 
1 280 
1 330 
1 338 
1 341 
1 406 
City
name
Ascending orderApartments
apt.
Price per m²
580 
675 
682