emooki
HomePrice mapTransactions
🇬🇧 English🇫🇷 Français🇩🇪 Deutsch🇪🇸 Español🇮🇹 Italiano

Real estate price map


Real estate price map in the municipality of Créteil.

Val-de-Marne (94)
Créteil

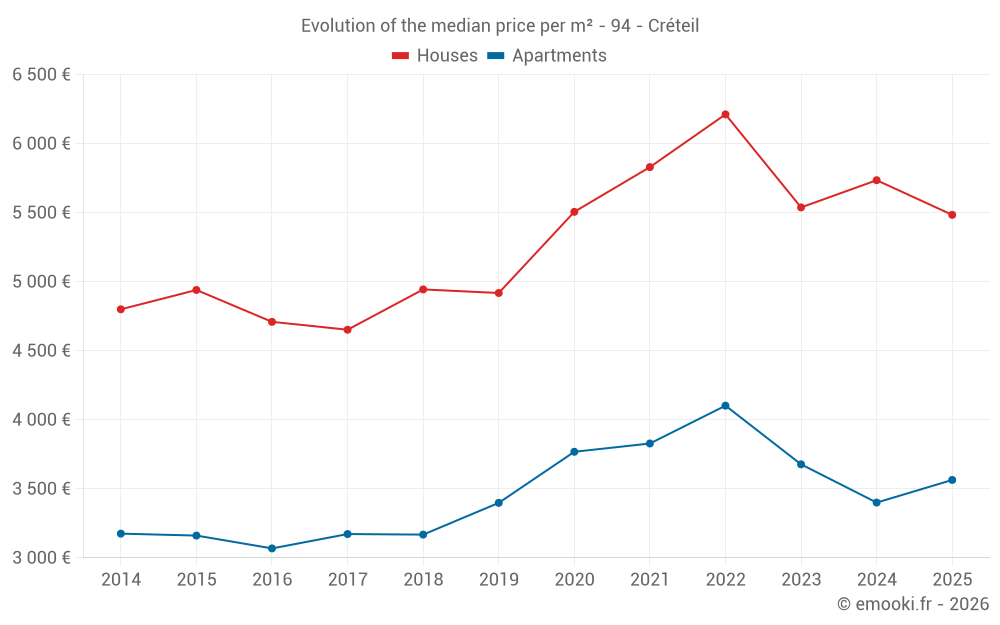
Median price of real estate
in the municipality of Créteil

HousesHouses
5 484  /m²
1-23-45-67-89-10
Reliability 9/10
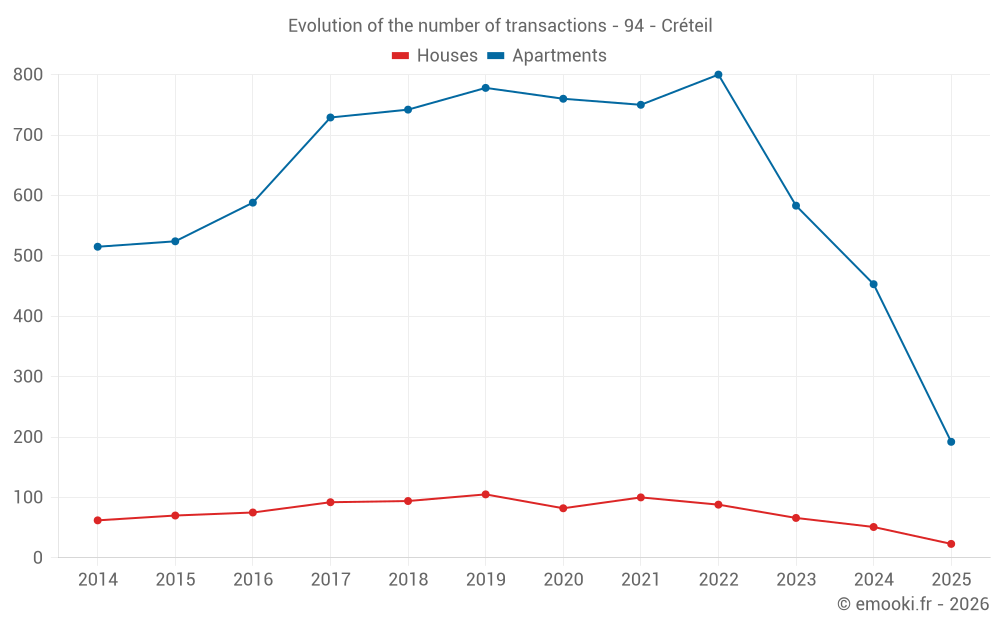
Median price on the 23 transactions of the last 6 months.
from 4 872 to
7 410  /m²
60% of transactions from the 2nd to the 8th deciles.
ApartmentsApartments
3 293  /m²
1-23-45-67-89-10
Reliability 10/10
Median price on the 76 transactions of the last 3 months.
from 2 672 to
4 384  /m²
60% of transactions from the 2nd to the 8th deciles.
DwellingsDwellings
3 402  /m²
1-23-45-67-89-10
Reliability 10/10
Median price on the 84 transactions of the last 3 months.
from 2 743 to
5 100  /m²
60% of transactions from the 2nd to the 8th deciles.
HousesEvolution of the price per m² of houses since...
1 year
-4.4%
2 years
-1%
3 years
-12%
4 years
-5.9%
5 years
-0.4%
6 years
+12%
7 years
+11%
8 years
+18%
9 years
+16%
10 years
+11%
11 years
+14%
ApartmentsEvolution of the price per m² of apartments since...
1 year
+4.8%
2 years
-3.1%
3 years
-13%
4 years
-6.9%
5 years
-5.4%
6 years
+4.9%
7 years
+13%
8 years
+12%
9 years
+16%
10 years
+13%
11 years
+12%

Yearly evolution

Evolution of the median price per m²

Evolution of the number of transactions

Warning, last year incomplete. Projections made based on the proportions between semesters of the previous year at the departmental/national level and by type of property.

Yearly data

Descending order
Year
Houses
house
transactions
Houses
house
Price per m²
Apartments
apt.
transactions
Apartments
apt.
Price per m²
2025
23
5 484 
192
3 564 
2024
51
5 735 
453
3 400 
2023
66
5 538 
583
3 677 
2022
88
6 212 
800
4 102 
2021
100
5 830 
750
3 828 
2020
82
5 506 
760
3 768 
2019
105
4 918 
778
3 398 
2018
94
4 944 
742
3 168 
2017
92
4 652 
729
3 172 
2016
75
4 709 
588
3 068 
2015
70
4 940 
524
3 161 
2014
62
4 800 
515
3 175 

Analysis

Structure of prices per m²

Values of price percentiles per m² over the periods used for the estimated price of each type of property.

Structure of transaction amounts

Values of transaction amounts percentiles over the periods used for the estimated price of each type of property.

Transaction amounts and prices per m² by percentile

Ascending order
Percentile
Houses
house
Price per m²
Houses
house
Transaction amount
Apartments
apt.
Price per m²
Apartments
apt.
Transaction amount
10th percentile
4 630 
247 K
2 556 
117 K
20th percentile
4 872 
303 K
2 672 
145 K
30th percentile
5 250 
357 K
2 898 
158 K
40th percentile
5 298 
386 K
3 083 
178 K
50th percentile
5 484 
498 K
3 293 
193 K
60th percentile
6 605 
605 K
3 594 
215 K
70th percentile
7 132 
642 K
3 992 
232 K
80th percentile
7 410 
725 K
4 384 
245 K
90th percentile
8 621 
756 K
5 109 
293 K

National and departmental comparison

Evolution of the median price per m² of houses

Evolution of the median price per m² of apartments

Quarterly evolution

Evolution of the median price per m²

Evolution of the number of transactions

Quarterly data

Descending order
Quarter
Houses
house
transactions
Houses
house
Price per m²
Apartments
apt.
transactions
Apartments
apt.
Price per m²
2025 Q2
8
7 180 
76
3 293 
2025 Q1
15
5 300 
116
3 654 
2024 Q4
13
5 667 
115
3 214 
2024 Q3
22
5 634 
129
3 435 
2024 Q2
8
5 912 
115
3 333 
2024 Q1
8
6 011 
94
3 541 
2023 Q4
14
5 000 
155
3 500 
2023 Q3
16
5 434 
143
3 807 
2023 Q2
19
5 129 
153
3 376 
2023 Q1
17
6 850 
132
3 842 
2022 Q4
22
6 164 
168
3 934 
2022 Q3
18
5 993 
216
4 146 
2022 Q2
19
6 500 
227
4 066 
2022 Q1
29
6 228 
189
4 094 
2021 Q4
18
6 034 
208
3 915 
2021 Q3
40
6 044 
196
3 812 
2021 Q2
22
5 452 
193
3 739 
2021 Q1
20
5 456 
153
3 714 
2020 Q4
32
5 415 
260
4 106 
2020 Q3
23
6 028 
198
3 810 
2020 Q2
10
5 584 
143
3 690 
2020 Q1
17
5 430 
159
3 403 
2019 Q4
26
4 954 
194
3 438 
2019 Q3
35
4 988 
210
3 396 
2019 Q2
23
5 101 
187
3 393 
2019 Q1
21
4 409 
187
3 367 
2018 Q4
22
5 134 
198
3 190 
2018 Q3
25
5 000 
197
3 173 
2018 Q2
18
4 578 
182
3 174 
2018 Q1
29
5 023 
165
3 130 
2017 Q4
25
5 357 
169
3 333 
2017 Q3
27
4 000 
219
3 263 
2017 Q2
21
4 497 
184
3 088 
2017 Q1
19
5 159 
157
3 125 
2016 Q4
15
4 515 
138
3 176 
2016 Q3
24
4 984 
175
2 955 
2016 Q2
18
4 516 
160
3 070 
2016 Q1
18
4 973 
115
3 070 
2015 Q4
17
6 000 
118
3 144 
2015 Q3
30
4 806 
168
3 176 
2015 Q2
11
5 458 
113
3 093 
2015 Q1
12
4 424 
125
3 261 
2014 Q4
17
4 348 
139
3 030 
2014 Q3
17
4 829 
134
3 274 
2014 Q2
15
4 619 
108
3 279 
2014 Q1
13
5 729 
134
3 209 

Val-de-Marne (94)

Most expensive cities

City
name
Descending orderHouses
house
Price per m²
11 952 
11 467 
8 514 
8 109 
6 752 
City
name
Descending orderApartments
apt.
Price per m²
8 716 
8 516 
5 909 
5 689 
5 638 

Least expensive cities

City
name
Ascending orderHouses
house
Price per m²
3 305 
3 308 
3 358 
3 417 
3 731 
City
name
Ascending orderApartments
apt.
Price per m²
2 916 
3 054 
3 182 
3 203 
3 293