emooki
HomePrice mapTransactions
🇬🇧 English🇫🇷 Français🇩🇪 Deutsch🇪🇸 Español🇮🇹 Italiano

Real estate price map


Real estate price map in the municipality of Gentilly, choose a section to see transactions by parcel.

Val-de-Marne (94)

Gentilly - Real estate price m²

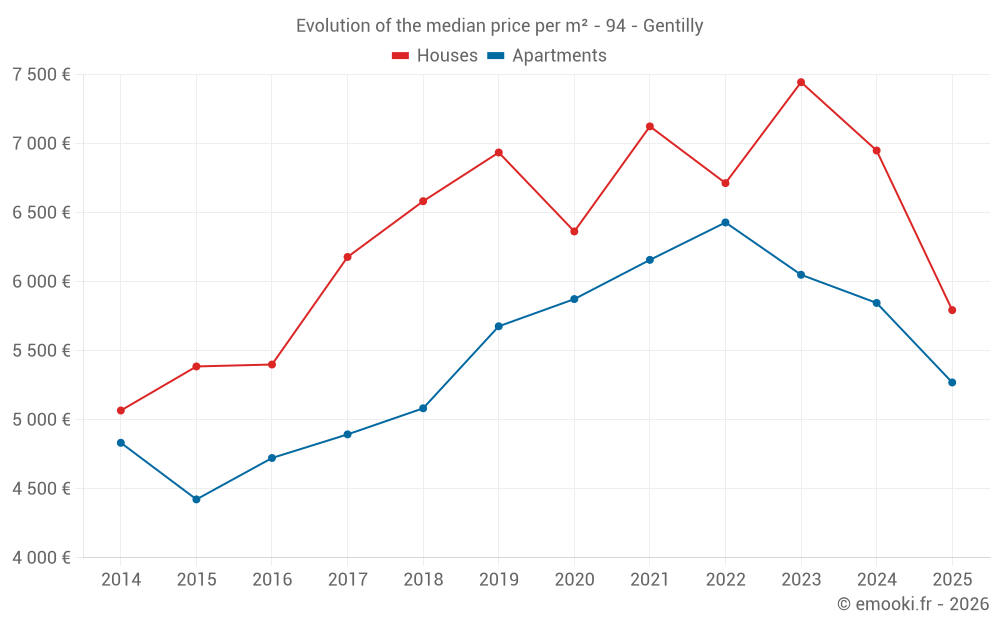
Median price of real estate
in the municipality of Gentilly

HousesHouses
6 752  /m²
1-23-45-67-89-10
Reliability 8/10
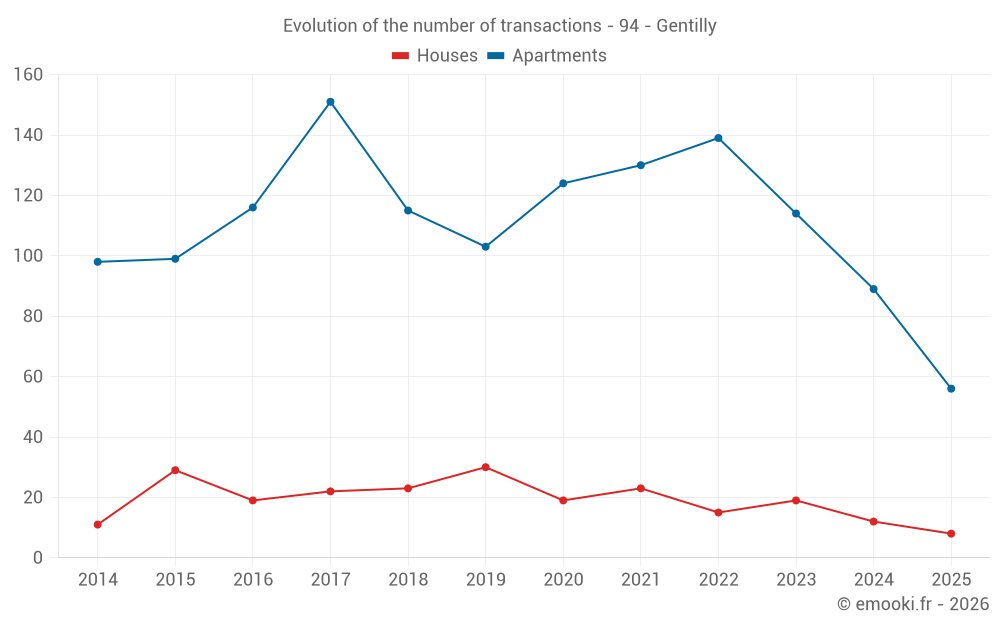
Median price on the 16 transactions of the last 12 months.
from 5 394 to
8 500  /m²
60% of transactions from the 2nd to the 8th deciles.
ApartmentsApartments
5 638  /m²
1-23-45-67-89-10
Reliability 10/10
Median price on the 25 transactions of the last 3 months.
from 4 623 to
6 215  /m²
60% of transactions from the 2nd to the 8th deciles.
DwellingsDwellings
5 632  /m²
1-23-45-67-89-10
Reliability 10/10
Median price on the 28 transactions of the last 3 months.
from 4 838 to
6 080  /m²
60% of transactions from the 2nd to the 8th deciles.
HousesEvolution of the price per m² of houses since...
1 year
-17%
2 years
-22%
3 years
-14%
4 years
-19%
5 years
-9%
6 years
-16%
7 years
-12%
8 years
-6.2%
9 years
+7.3%
10 years
+7.6%
11 years
+14%
The price per m² of houses has decreased by 22% since 2 years, but it has increased by 14% in 11 years.
ApartmentsEvolution of the price per m² of apartments since...
1 year
-10%
2 years
-13%
3 years
-18%
4 years
-14%
5 years
-10%
6 years
-7.2%
7 years
+3.7%
8 years
+7.7%
9 years
+12%
10 years
+19%
11 years
+9%
The price per m² of apartments has decreased by 18% since 3 years, but it has increased by 19% in 10 years.

Yearly evolution

Evolution of the median price per m²

Evolution of the median price per m² - 94 - Gentilly

Evolution of the number of transactions

Warning, last year incomplete. Projections made based on the proportions between semesters of the previous year at the departmental/national level and by type of property.

Evolution of the number of transactions - 94 - Gentilly

Yearly data

Descending order
Year
Houses
house
transactions
Houses
house
Price per m²
Apartments
apt.
transactions
Apartments
apt.
Price per m²
2025
8
5 794 
56
5 270 
2024
12
6 950 
89
5 846 
2023
19
7 445 
114
6 050 
2022
15
6 714 
139
6 429 
2021
23
7 125 
130
6 158 
2020
19
6 364 
124
5 874 
2019
30
6 936 
103
5 677 
2018
23
6 583 
115
5 083 
2017
22
6 179 
151
4 894 
2016
19
5 400 
116
4 723 
2015
29
5 386 
99
4 423 
2014
11
5 067 
98
4 833 

Analysis

Structure of prices per m²

Values of price percentiles per m² over the periods used for the estimated price of each type of property.

Structure of transaction amounts

Values of transaction amounts percentiles over the periods used for the estimated price of each type of property.

Transaction amounts and prices per m² by percentile

Ascending order
Percentile
Houses
house
Price per m²
Houses
house
Transaction amount
Apartments
apt.
Price per m²
Apartments
apt.
Transaction amount
10th percentile
4 664 
334 K
4 306 
152 K
20th percentile
5 394 
365 K
4 623 
185 K
30th percentile
5 574 
499 K
5 106 
211 K
40th percentile
5 962 
540 K
5 263 
268 K
50th percentile
6 752 
616 K
5 638 
275 K
60th percentile
6 851 
740 K
5 665 
293 K
70th percentile
7 436 
787 K
5 926 
349 K
80th percentile
8 500 
850 K
6 215 
369 K
90th percentile
10 156 
1 155 K
6 631 
399 K

National and departmental comparison

Evolution of the median price per m² of houses

Evolution of the median price per m² of apartments

Quarterly evolution

Evolution of the median price per m²

Evolution of the number of transactions

Quarterly data

Descending order
Quarter
Houses
house
transactions
Houses
house
Price per m²
Apartments
apt.
transactions
Apartments
apt.
Price per m²
2025 Q2
3
5 625 
25
5 638 
2025 Q1
5
6 797 
31
5 235 
2024 Q4
4
7 604 
15
5 543 
2024 Q3
4
7 436 
23
5 726 
2024 Q2
2
5 796 
30
5 931 
2024 Q1
2
9 478 
21
5 952 
2023 Q4
4
7 602 
23
5 952 
2023 Q3
6
7 740 
32
6 100 
2023 Q2
5
6 745 
30
5 759 
2023 Q1
4
8 295 
29
6 138 
2022 Q4
3
6 619 
31
6 280 
2022 Q3
2
8 124 
36
6 564 
2022 Q2
4
7 415 
40
6 646 
2022 Q1
6
6 424 
32
6 814 
2021 Q4
4
6 778 
30
6 920 
2021 Q3
10
7 721 
35
6 607 
2021 Q2
5
7 556 
40
5 706 
2021 Q1
4
6 069 
25
5 560 
2020 Q4
3
5 652 
26
5 795 
2020 Q3
4
5 348 
29
6 241 
2020 Q2
5
7 211 
36
5 942 
2020 Q1
7
6 636 
33
5 600 
2019 Q4
5
8 543 
28
5 640 
2019 Q3
10
6 823 
28
5 628 
2019 Q2
8
6 936 
26
5 744 
2019 Q1
7
5 254 
21
5 680 
2018 Q4
7
5 962 
28
5 018 
2018 Q3
11
7 167 
28
5 214 
2018 Q2
2
8 155 
22
5 553 
2018 Q1
3
6 651 
37
4 806 
2017 Q4
4
5 070 
40
4 872 
2017 Q3
7
5 778 
39
5 082 
2017 Q2
5
6 731 
34
5 061 
2017 Q1
6
7 080 
38
4 792 
2016 Q4
7
4 851 
31
4 868 
2016 Q3
6
5 669 
34
4 793 
2016 Q2
2
1 622 
28
4 366 
2016 Q1
4
6 280 
23
4 545 
2015 Q4
8
5 248 
34
4 497 
2015 Q3
7
5 583 
29
4 480 
2015 Q2
5
5 385 
13
4 359 
2015 Q1
9
5 386 
23
4 400 
2014 Q4
2
5 270 
16
4 564 
2014 Q3
2
6 832 
25
5 029 
2014 Q2
2
6 664 
13
4 909 
2014 Q1
5
5 067 
44
4 714 

Overview of the latest real estate transactions

The following list is an anonymized overview of the latest transactions. For more details and to find all transactions, please use the map to view transactions by plot or the transaction search page for a search by criteria.

2025-06-16
288 968 
6 148  /m²(47 m²)
Sale
Apartments
Apartment
1 room
47 m2
1 outbuilding
2025-06-10
405 000 
5 127  /m²(79 m²)
Sale
Apartments
Apartment
4 rooms
79 m2
1 outbuilding
1 outbuilding
2025-05-27
275 000 
5 978  /m²(46 m²)
Sale
Apartments
Apartment
2 rooms
46 m2
1 outbuilding
2025-05-19
270 000 
5 094  /m²(53 m²)
Sale
Apartments
Apartment
3 rooms
53 m2
1 outbuilding
2025-05-12
5 000 
Sale
1 outbuilding
2025-05-07
360 000 
4 390  /m²(82 m²)
Sale
Apartments
Apartment
4 rooms
82 m2
2 outbuildings
2025-04-30
272 000 
3 317  /m²(82 m²)
Sale
Apartments
Apartment
3 rooms
82 m2
1 outbuilding
2025-04-30
175 000 
5 833  /m²(30 m²)
Sale
Apartments
Apartment
2 rooms
30 m2
1 outbuilding
2025-04-30
650 000 
2 321  /m²(280 m²)
Sale
Commercial property
280 m2
Land
483 m2
-Sols
2025-04-30
389 000 
6 483  /m²(60 m²)
Sale
Apartments
Apartment
3 rooms
60 m2
1 outbuilding
2025-04-30
338 000 
5 281  /m²(64 m²)
Sale
Apartments
Apartment
3 rooms
64 m2
1 outbuilding
2025-04-29
169 500 
5 650  /m²(30 m²)
Sale
Apartments
Apartment
2 rooms
30 m2
1 outbuilding
2025-04-29
464 000 
5 524  /m²(84 m²)
Sale
Houses
House
4 rooms
84 m2
Land
112 m2
-Sols
2025-04-28
379 000 
5 657  /m²(67 m²)
Sale
Apartments
Apartment
3 rooms
67 m2
2 outbuildings
2025-04-28
540 000 
5 625  /m²(96 m²)
Sale
Houses
House
4 rooms
96 m2
Land
122 m2
-Sols
2025-04-28
215 000 
6 515  /m²(33 m²)
Sale
Apartments
Apartment
1 room
33 m2
2025-04-28
17 000 
Sale
1 outbuilding
2025-04-25
470 000 
5 949  /m²(79 m²)
Sale
Apartments
Apartment
3 rooms
79 m2
2025-04-24
21 000 
Sale
1 outbuilding
2025-04-24
352 000 
5 101  /m²(69 m²)
Sale
Apartments
Apartment
3 rooms
69 m2
1 outbuilding
2713 transactions listed in the municipality

Val-de-Marne (94)

Most expensive cities

City
name
Descending orderHouses
house
Price per m²
11 952 
11 467 
8 514 
8 109 
6 752 
City
name
Descending orderApartments
apt.
Price per m²
8 716 
8 516 
5 909 
5 689 
5 638 

Least expensive cities

City
name
Ascending orderHouses
house
Price per m²
3 305 
3 308 
3 358 
3 417 
3 731 
City
name
Ascending orderApartments
apt.
Price per m²
2 916 
3 054 
3 182 
3 203 
3 293