Median price of real estate
in the municipality of Champs-sur-Marne
Houses
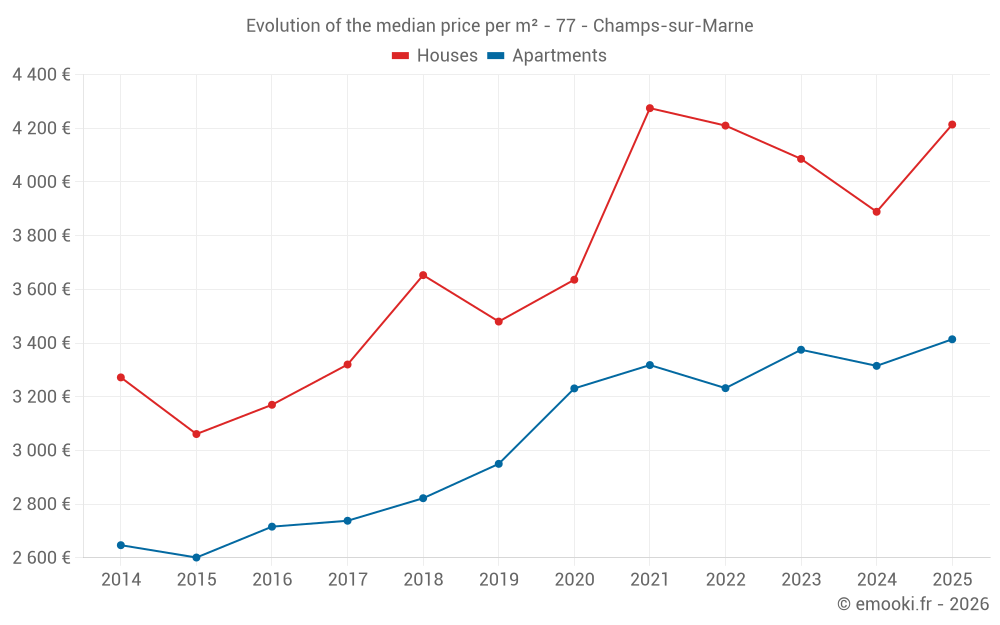
4 214 € /m²
Reliability 9/10
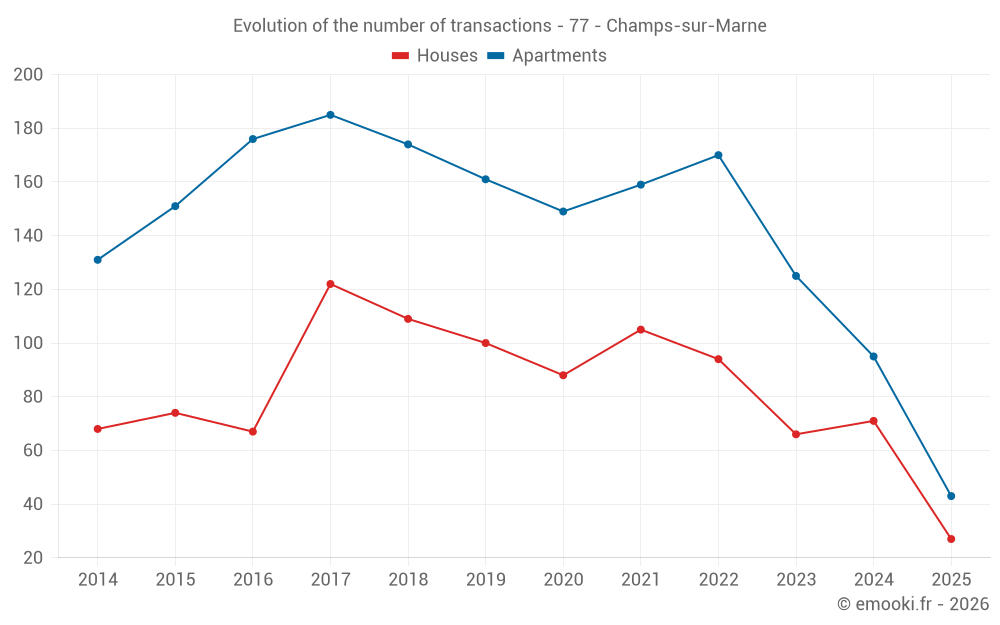
Median price on the 27 transactions of the last 6 months.
from 3 464 to
4 610 € /m²
4 610 € /m²
60% of transactions from the 2nd to the 8th deciles.
Apartments
3 638 € /m²
Reliability 10/10
Median price on the 21 transactions of the last 3 months.
from 2 769 to
3 681 € /m²
3 681 € /m²
60% of transactions from the 2nd to the 8th deciles.
Dwellings
3 662 € /m²
Reliability 10/10
Median price on the 34 transactions of the last 3 months.
from 2 846 to
4 376 € /m²
4 376 € /m²
60% of transactions from the 2nd to the 8th deciles.