emooki
HomePrice mapTransactions
🇬🇧 English🇫🇷 Français🇩🇪 Deutsch🇪🇸 Español🇮🇹 Italiano

Real estate price map


Real estate price map in the municipality of Chennevières-sur-Marne.

Val-de-Marne (94)
Chennevières-sur-Marne

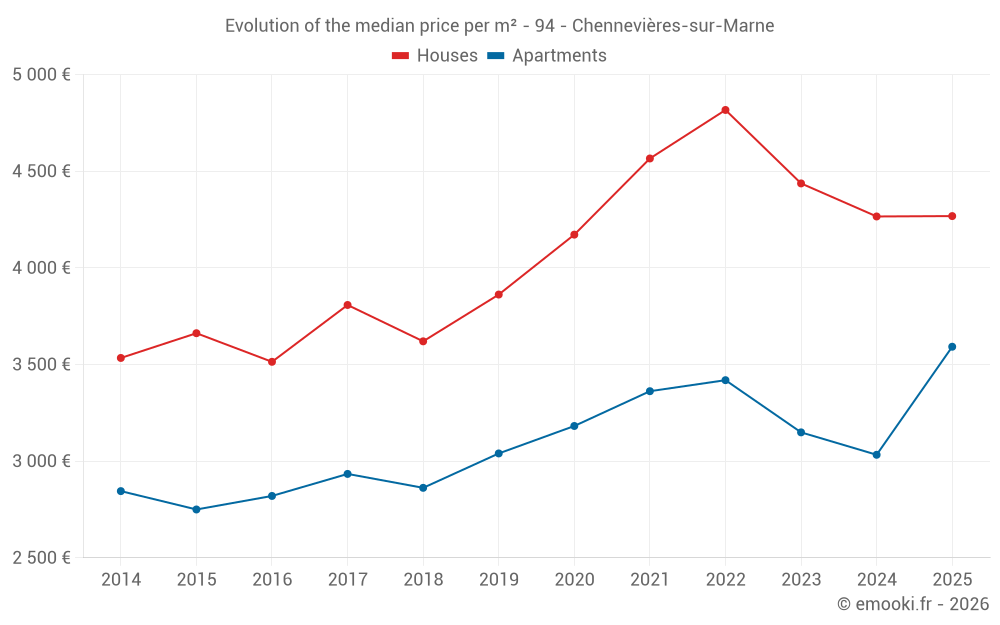
Median price of real estate
in the municipality of Chennevières-sur-Marne

HousesHouses
4 082  /m²
1-23-45-67-89-10
Reliability 8/10
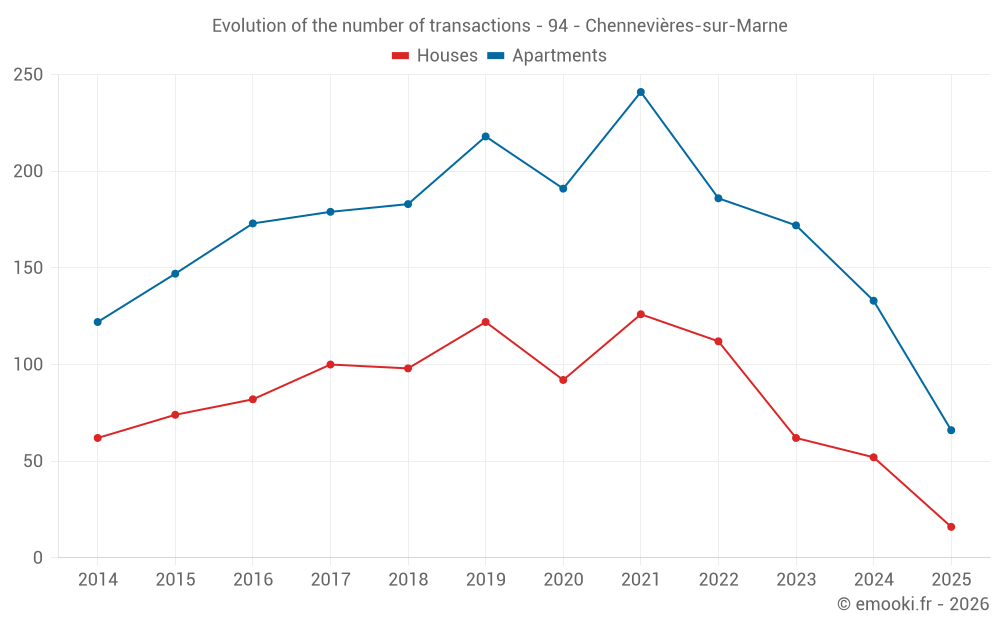
Median price on the 43 transactions of the last 12 months.
from 3 361 to
5 432  /m²
60% of transactions from the 2nd to the 8th deciles.
ApartmentsApartments
3 260  /m²
1-23-45-67-89-10
Reliability 10/10
Median price on the 24 transactions of the last 3 months.
from 2 729 to
4 632  /m²
60% of transactions from the 2nd to the 8th deciles.
DwellingsDwellings
3 482  /m²
1-23-45-67-89-10
Reliability 10/10
Median price on the 30 transactions of the last 3 months.
from 2 761 to
4 675  /m²
60% of transactions from the 2nd to the 8th deciles.
HousesEvolution of the price per m² of houses since...
1 year
+0%
2 years
-3.8%
3 years
-11%
4 years
-6.5%
5 years
+2.3%
6 years
+11%
7 years
+18%
8 years
+12%
9 years
+21%
10 years
+17%
11 years
+21%
ApartmentsEvolution of the price per m² of apartments since...
1 year
+18%
2 years
+14%
3 years
+5.1%
4 years
+6.8%
5 years
+13%
6 years
+18%
7 years
+26%
8 years
+22%
9 years
+27%
10 years
+31%
11 years
+26%

Yearly evolution

Evolution of the median price per m²

Evolution of the number of transactions

Warning, last year incomplete. Projections made based on the proportions between semesters of the previous year at the departmental/national level and by type of property.

Yearly data

Descending order
Year
Houses
house
transactions
Houses
house
Price per m²
Apartments
apt.
transactions
Apartments
apt.
Price per m²
2025
16
4 268 
66
3 592 
2024
52
4 266 
133
3 033 
2023
62
4 437 
172
3 149 
2022
112
4 817 
186
3 419 
2021
126
4 566 
241
3 362 
2020
92
4 172 
191
3 182 
2019
122
3 862 
218
3 040 
2018
98
3 620 
183
2 862 
2017
100
3 808 
179
2 934 
2016
82
3 514 
173
2 820 
2015
74
3 662 
147
2 750 
2014
62
3 534 
122
2 845 

Analysis

Structure of prices per m²

Values of price percentiles per m² over the periods used for the estimated price of each type of property.

Structure of transaction amounts

Values of transaction amounts percentiles over the periods used for the estimated price of each type of property.

Transaction amounts and prices per m² by percentile

Ascending order
Percentile
Houses
house
Price per m²
Houses
house
Transaction amount
Apartments
apt.
Price per m²
Apartments
apt.
Transaction amount
10th percentile
3 007 
265 K
2 603 
151 K
20th percentile
3 361 
296 K
2 729 
160 K
30th percentile
3 668 
327 K
2 872 
169 K
40th percentile
3 910 
363 K
3 000 
174 K
50th percentile
4 082 
390 K
3 260 
184 K
60th percentile
4 296 
412 K
3 792 
191 K
70th percentile
4 551 
476 K
3 955 
217 K
80th percentile
5 432 
576 K
4 632 
231 K
90th percentile
6 350 
872 K
5 232 
288 K

National and departmental comparison

Evolution of the median price per m² of houses

Evolution of the median price per m² of apartments

Quarterly evolution

Evolution of the median price per m²

Evolution of the number of transactions

Quarterly data

Descending order
Quarter
Houses
house
transactions
Houses
house
Price per m²
Apartments
apt.
transactions
Apartments
apt.
Price per m²
2025 Q2
6
3 838 
24
3 260 
2025 Q1
10
4 402 
42
3 646 
2024 Q4
10
3 783 
44
2 862 
2024 Q3
17
3 948 
36
2 961 
2024 Q2
9
4 281 
30
3 170 
2024 Q1
16
4 740 
23
3 677 
2023 Q4
10
5 224 
41
3 203 
2023 Q3
18
4 082 
53
3 364 
2023 Q2
19
4 545 
40
2 797 
2023 Q1
15
5 345 
38
3 145 
2022 Q4
30
4 844 
46
3 448 
2022 Q3
25
4 971 
43
3 284 
2022 Q2
39
4 804 
53
3 451 
2022 Q1
18
4 996 
44
3 411 
2021 Q4
33
4 761 
48
3 252 
2021 Q3
40
4 964 
78
3 556 
2021 Q2
34
4 442 
59
3 409 
2021 Q1
19
4 256 
56
3 374 
2020 Q4
30
4 176 
47
3 409 
2020 Q3
26
3 974 
48
3 440 
2020 Q2
18
3 900 
51
2 705 
2020 Q1
18
4 478 
45
3 233 
2019 Q4
27
3 712 
58
3 572 
2019 Q3
29
3 890 
58
2 840 
2019 Q2
40
4 104 
44
3 006 
2019 Q1
26
3 590 
58
2 731 
2018 Q4
25
2 890 
47
2 689 
2018 Q3
26
3 384 
48
2 823 
2018 Q2
25
4 263 
46
2 897 
2018 Q1
22
3 655 
42
2 950 
2017 Q4
31
3 952 
41
3 136 
2017 Q3
20
3 964 
56
2 860 
2017 Q2
26
3 900 
36
2 658 
2017 Q1
23
3 556 
46
3 051 
2016 Q4
23
3 409 
33
2 769 
2016 Q3
21
3 455 
49
2 934 
2016 Q2
25
3 750 
47
2 750 
2016 Q1
13
3 657 
44
2 808 
2015 Q4
19
3 672 
41
2 727 
2015 Q3
32
3 620 
38
2 744 
2015 Q2
11
3 459 
30
2 720 
2015 Q1
12
3 863 
38
2 900 
2014 Q4
13
3 508 
29
2 764 
2014 Q3
19
4 692 
43
2 738 
2014 Q2
14
3 722 
21
2 954 
2014 Q1
16
3 240 
29
3 068 

Val-de-Marne (94)

Most expensive cities

City
name
Descending orderHouses
house
Price per m²
11 952 
11 467 
8 514 
8 109 
6 752 
City
name
Descending orderApartments
apt.
Price per m²
8 716 
8 516 
5 909 
5 689 
5 638 

Least expensive cities

City
name
Ascending orderHouses
house
Price per m²
3 305 
3 308 
3 358 
3 417 
3 731 
City
name
Ascending orderApartments
apt.
Price per m²
2 916 
3 054 
3 182 
3 203 
3 293