emooki
HomePrice mapTransactions
🇬🇧 English🇫🇷 Français🇩🇪 Deutsch🇪🇸 Español🇮🇹 Italiano

Real estate price map


Real estate price map in the Orne department.

Department 61
Orne

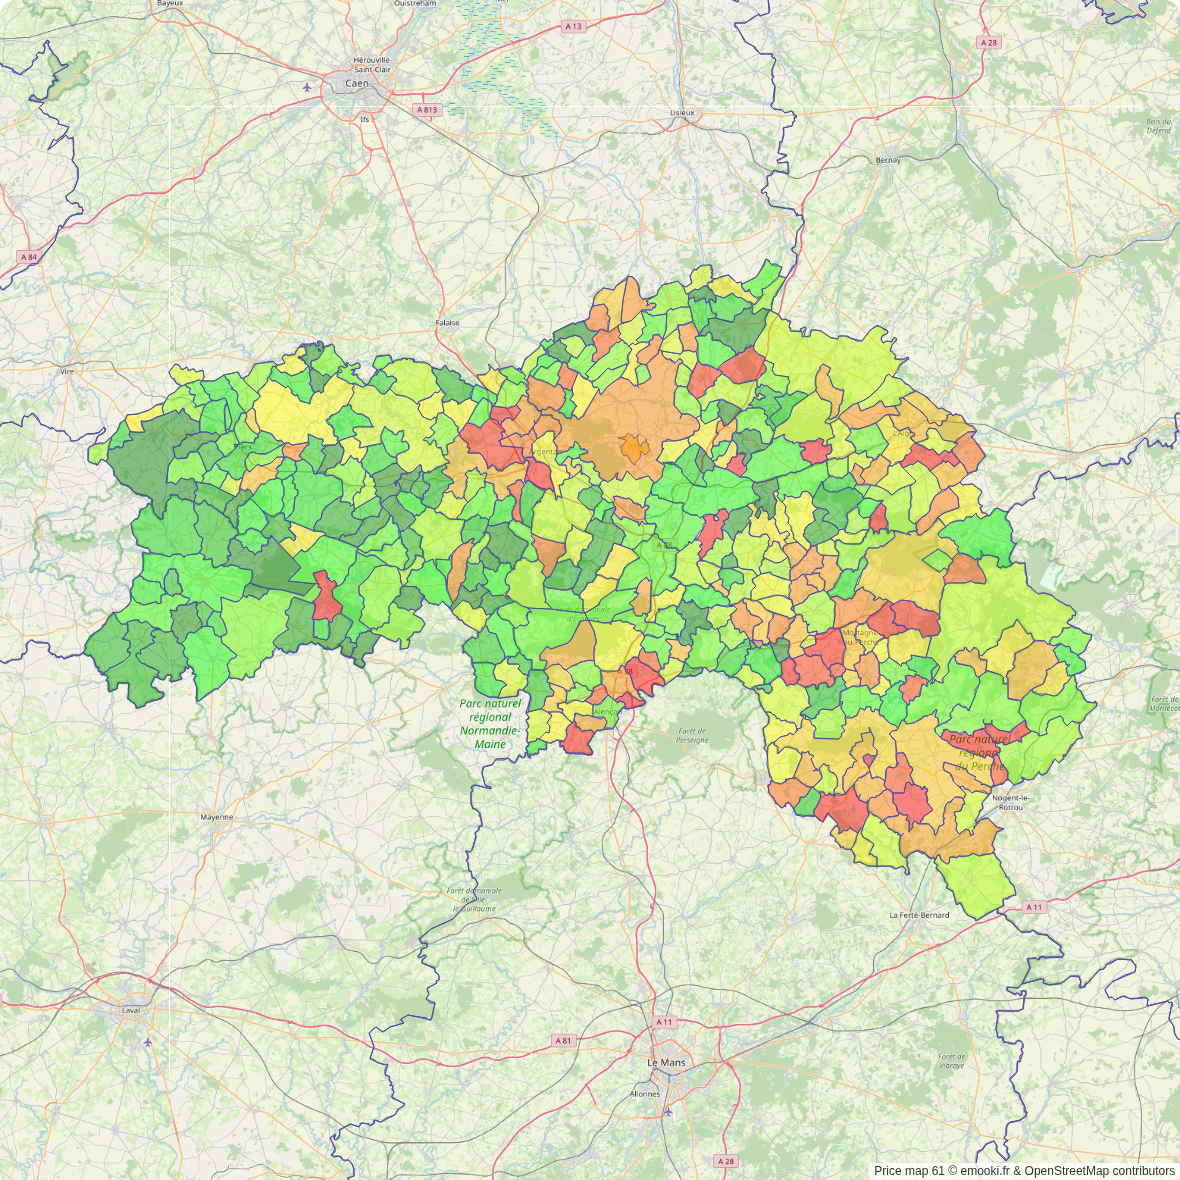
Median price of real estate
in the Orne department

HousesHouses
1 335 € /m²
1-23-45-67-89-10
Reliability 10/10
Median price on the 563 transactions of the last 3 months.
from 781 to
1 863 € /m²
60% of transactions from the 2nd to the 8th deciles.
ApartmentsApartments
1 140 € /m²
1-23-45-67-89-10
Reliability 9/10
Median price on the 164 transactions of the last 6 months.
from 732 to
1 769 € /m²
60% of transactions from the 2nd to the 8th deciles.
DwellingsDwellings
1 318 € /m²
1-23-45-67-89-10
Reliability 10/10
Median price on the 642 transactions of the last 3 months.
from 774 to
1 854 € /m²
60% of transactions from the 2nd to the 8th deciles.
HousesEvolution of the price per m² of houses since...
1 year
+2.3%
2 years
+4.3%
3 years
+3.1%
4 years
+13%
5 years
+19%
6 years
+27%
7 years
+26%
8 years
+27%
9 years
+28%
10 years
+27%
11 years
+23%
ApartmentsEvolution of the price per m² of apartments since...
1 year
-5.9%
2 years
-4.8%
3 years
-8.8%
4 years
+7.8%
5 years
+10%
6 years
+22%
7 years
+20%
8 years
+16%
9 years
+16%
10 years
+14%
11 years
+13%

Yearly evolution

Evolution of the median price per m²

Evolution of the number of transactions

Warning, last year incomplete. Projections made based on the proportions between semesters of the previous year at the departmental/national level and by type of property.

Yearly data

Descending order
Year
Houses
house
transactions
Houses
house
Price per m²
Apartments
apt.
transactions
Apartments
apt.
Price per m²
2025
1 244
1 343 €
164
1 140 €
2024
3 219
1 313 €
432
1 211 €
2023
3 356
1 288 €
480
1 197 €
2022
4 219
1 302 €
549
1 250 €
2021
4 719
1 189 €
525
1 058 €
2020
3 900
1 125 €
452
1 032 €
2019
3 566
1 060 €
450
938 €
2018
3 229
1 067 €
363
947 €
2017
3 120
1 055 €
373
987 €
2016
2 785
1 050 €
332
980 €
2015
2 595
1 057 €
293
1 000 €
2014
2 445
1 092 €
260
1 009 €

Analysis

Structure of prices per m²

Values of price percentiles per m² over the periods used for the estimated price of each type of property.

Structure of transaction amounts

Values of transaction amounts percentiles over the periods used for the estimated price of each type of property.

Transaction amounts and prices per m² by percentile

Ascending order
Percentile
Houses
house
Price per m²
Houses
house
Transaction amount
Apartments
apt.
Price per m²
Apartments
apt.
Transaction amount
10th percentile
486 €
40 000 €
528 €
28 600 €
20th percentile
781 €
64 520 €
732 €
37 000 €
30th percentile
995 €
82 340 €
873 €
45 000 €
40th percentile
1 190 €
100 K€
992 €
55 000 €
50th percentile
1 335 €
115 K€
1 140 €
61 750 €
60th percentile
1 466 €
134 K€
1 276 €
70 000 €
70th percentile
1 674 €
160 K€
1 455 €
81 470 €
80th percentile
1 863 €
190 K€
1 769 €
94 400 €
90th percentile
2 214 €
250 K€
2 190 €
124 K€

Quarterly evolution

Evolution of the median price per m²

Evolution of the number of transactions

Quarterly data

Descending order
Quarter
Houses
house
transactions
Houses
house
Price per m²
Apartments
apt.
transactions
Apartments
apt.
Price per m²
2025 Q2
563
1 335 €
79
1 181 €
2025 Q1
681
1 349 €
85
1 078 €
2024 Q4
908
1 304 €
118
1 252 €
2024 Q3
900
1 358 €
117
1 279 €
2024 Q2
745
1 311 €
98
1 144 €
2024 Q1
666
1 241 €
99
1 176 €
2023 Q4
864
1 253 €
111
1 200 €
2023 Q3
908
1 304 €
109
1 171 €
2023 Q2
769
1 313 €
128
1 270 €
2023 Q1
815
1 280 €
132
1 160 €
2022 Q4
996
1 354 €
139
1 359 €
2022 Q3
1 186
1 322 €
125
1 250 €
2022 Q2
1 070
1 279 €
159
1 215 €
2022 Q1
967
1 241 €
126
1 136 €
2021 Q4
1 255
1 212 €
114
1 137 €
2021 Q3
1 257
1 237 €
147
1 037 €
2021 Q2
1 181
1 167 €
143
1 009 €
2021 Q1
1 026
1 141 €
121
1 055 €
2020 Q4
1 299
1 143 €
133
977 €
2020 Q3
1 051
1 125 €
106
972 €
2020 Q2
752
1 110 €
121
1 040 €
2020 Q1
798
1 116 €
92
1 080 €
2019 Q4
936
1 064 €
123
1 022 €
2019 Q3
1 014
1 102 €
109
938 €
2019 Q2
856
1 044 €
99
902 €
2019 Q1
760
1 016 €
119
926 €
2018 Q4
903
1 042 €
100
1 098 €
2018 Q3
825
1 075 €
84
915 €
2018 Q2
762
1 092 €
97
947 €
2018 Q1
739
1 058 €
82
878 €
2017 Q4
854
1 034 €
89
1 030 €
2017 Q3
837
1 053 €
102
1 015 €
2017 Q2
710
1 050 €
98
934 €
2017 Q1
719
1 090 €
84
943 €
2016 Q4
769
1 067 €
89
1 017 €
2016 Q3
755
1 071 €
91
983 €
2016 Q2
678
1 034 €
85
924 €
2016 Q1
583
1 000 €
67
1 063 €
2015 Q4
749
1 071 €
75
951 €
2015 Q3
719
1 071 €
67
978 €
2015 Q2
654
1 056 €
90
1 013 €
2015 Q1
473
1 000 €
61
1 081 €
2014 Q4
649
1 080 €
67
971 €
2014 Q3
692
1 140 €
79
957 €
2014 Q2
575
1 067 €
51
1 156 €
2014 Q1
529
1 067 €
63
1 033 €

Orne (61)

Most expensive cities

City
name
Descending orderHouses
house
Price per m²
2 347 €
2 278 €
2 143 €
1 897 €
1 850 €
1 850 €
1 844 €
1 828 €
1 827 €
1 816 €
City
name
Descending orderApartments
apt.
Price per m²
2 150 €
1 840 €
1 776 €
1 634 €
1 574 €
1 548 €
1 542 €
1 481 €
1 470 €
1 453 €

Least expensive cities

City
name
Ascending orderHouses
house
Price per m²
385 €
532 €
620 €
659 €
669 €
677 €
701 €
726 €
740 €
City
name
Ascending orderApartments
apt.
Price per m²
7 €
20 €
129 €
162 €
174 €
201 €
262 €
281 €