Real estate price map
Real estate price map in the municipality of Lougé-sur-Maire, choose a section to see transactions by parcel.
Orne (61)
Price per m² in Lougé-sur-Maire
Median price of real estate
in the municipality of Lougé-sur-Maire
Houses
926 € /m²
Reliability 6/10
Median price on the 20 transactions of the last 36 months.
from 600 to
1 520 € /m²
1 520 € /m²
60% of transactions from the 2nd to the 8th deciles.
Yearly evolution
Evolution of the median price per m²

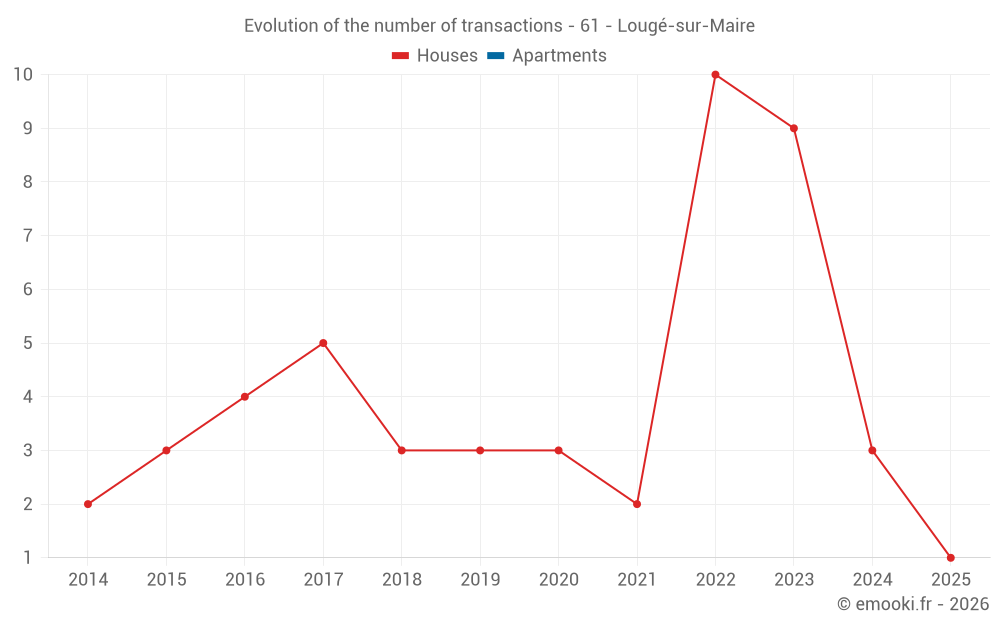
Evolution of the number of transactions
Warning, last year incomplete. Projections made based on the proportions between semesters of the previous year at the departmental/national level and by type of property.
Yearly data
Year
house
transactions
transactions
house
Price per m²
Price per m²
apt.
transactions
transactions
apt.
Price per m²
Price per m²
2025
1
2 152 €
0
--- €
2024
3
936 €
0
--- €
2023
9
915 €
0
--- €
2022
10
702 €
0
--- €
2021
2
1 045 €
0
--- €
2020
3
1 059 €
0
--- €
2019
3
500 €
0
--- €
2018
3
633 €
0
--- €
2017
5
667 €
0
--- €
2016
4
982 €
0
--- €
2015
3
1 187 €
0
--- €
2014
2
1 195 €
0
--- €
Analysis
Structure of prices per m²
Values of price percentiles per m² over the periods used for the estimated price of each type of property.
Structure of transaction amounts
Values of transaction amounts percentiles over the periods used for the estimated price of each type of property.
Transaction amounts and prices per m² by percentile
Percentile
house
Price per m²
Price per m²
house
Transaction amount
Transaction amount
apt.
Price per m²
Price per m²
apt.
Transaction amount
Transaction amount
10th percentile
457 €
37 450 €
--- €
--- €
20th percentile
600 €
55 316 €
--- €
--- €
30th percentile
853 €
59 700 €
--- €
--- €
40th percentile
878 €
85 922 €
--- €
--- €
50th percentile
926 €
109 K€
--- €
--- €
60th percentile
1 102 €
117 K€
--- €
--- €
70th percentile
1 223 €
154 K€
--- €
--- €
80th percentile
1 520 €
196 K€
--- €
--- €
90th percentile
1 685 €
215 K€
--- €
--- €
National and departmental comparison
Evolution of the median price per m² of houses
Evolution of the median price per m² of apartments
Quarterly evolution
Evolution of the median price per m²
Evolution of the number of transactions
Quarterly data
Quarter
house
transactions
transactions
house
Price per m²
Price per m²
apt.
transactions
transactions
apt.
Price per m²
Price per m²
2025 Q2
1
2 152 €
0
--- €
2024 Q2
3
936 €
0
--- €
2023 Q4
2
900 €
0
--- €
2023 Q3
3
857 €
0
--- €
2023 Q2
2
1 158 €
0
--- €
2023 Q1
2
938 €
0
--- €
2022 Q4
3
300 €
0
--- €
2022 Q3
4
1 282 €
0
--- €
2022 Q1
3
577 €
0
--- €
2021 Q3
2
1 045 €
0
--- €
2020 Q4
1
711 €
0
--- €
2020 Q3
1
1 059 €
0
--- €
2020 Q2
1
1 850 €
0
--- €
2019 Q4
1
290 €
0
--- €
2019 Q3
1
500 €
0
--- €
2019 Q2
1
1 038 €
0
--- €
2018 Q3
2
568 €
0
--- €
2018 Q1
1
1 344 €
0
--- €
2017 Q4
1
667 €
0
--- €
2017 Q3
3
1 272 €
0
--- €
2017 Q2
1
595 €
0
--- €
2016 Q4
1
1 340 €
0
--- €
2016 Q3
2
982 €
0
--- €
2016 Q1
1
661 €
0
--- €
2015 Q4
2
1 052 €
0
--- €
2015 Q1
1
1 667 €
0
--- €
2014 Q4
2
1 195 €
0
--- €
Overview of the latest real estate transactions
The following list is an anonymized overview of the latest transactions. For more details and to find all transactions, please use the map to view transactions by plot or the transaction search page for a search by criteria.
2025-04-28
500 €Sale
Land
1985 m2
-Sols
2025-04-10
226 000 €2 152 € /m²(105 m²)
Sale
House
4 rooms
105 m2
Land
1035 m2
-Terrains d'agrément
/Parc
Land
1000 m2
-Sols
Land
2421 m2
-Terrains à bâtir
2025-03-27
26 000 €Sale
Land
460 m2
-Prés
Land
95 m2
-Sols
2025-03-14
70 000 €Sale
Land
45838 m2
-Prés
Land
10431 m2
-Terres
Land
47960 m2
-Terres
Land
6745 m2
-Prés
Land
30580 m2
-Prés
Land
1410 m2
-Terres
2024-10-24
20 876 €Sale
Land
800 m2
-Prés
Land
29935 m2
-Prés
2024-09-23
178 000 €1 072 € /m²(166 m²)
3 179 € /m²(56 m²)
Sale
Commercial property
110 m2
1 outbuilding
Land
411 m2
-Sols
Land
469 m2
-Jardins
/Jardin potager
House
2 rooms
56 m2
1 outbuilding
Land
555 m2
-Sols
Land
184 m2
-Prés
2024-06-27
12 960 €Sale
Land
810 m2
-Terrains à bâtir
2024-06-07
109 000 €865 € /m²(126 m²)
Sale
House
5 rooms
97 m2
House
1 room
29 m2
1 outbuilding
Land
930 m2
-Sols
Land
2300 m2
-Prés
Land
520 m2
-Sols
Land
3577 m2
-Sols
Land
1469 m2
-Prés
2024-05-30
117 000 €936 € /m²(125 m²)
Sale
House
6 rooms
125 m2
2 outbuildings
Land
690 m2
-Sols
Land
654 m2
-Jardins
/Jardin potager
2024-05-30
215 000 €1 667 € /m²(129 m²)
Sale
House
5 rooms
129 m2
Land
1000 m2
-Sols
Land
382 m2
-Terrains d'agrément
/Parc
Land
215 m2
-Jardins
/Jardin potager
Land
2740 m2
-Prés
Land
150 m2
-Sols
2024-04-30
17 481 €Sale
Land
14600 m2
-Prés
Land
17183 m2
-Prés
2024-04-08
10 830 €Sale
Land
15106 m2
-Terres
Land
1834 m2
-Taillis sous futaie
2024-03-25
25 575 €Exchange
Land
18940 m2
-Terres
Land
12860 m2
-Terres
Land
36135 m2
-Prés
2024-02-13
22 260 €Sale
Land
18940 m2
-Terres
Land
12860 m2
-Terres
2024-01-10
143 976 €Sale
Land
14404 m2
-Terres
Land
57916 m2
-Prés
2023-12-20
11 344 €Sale
Land
709 m2
-Prés
2023-12-15
46 980 €886 € /m²(53 m²)
Sale
House
3 rooms
53 m2
Land
1330 m2
-Sols
Land
2500 m2
-Prés
Land
30 m2
-Sols
2023-12-12
20 500 €Sale
Land
20927 m2
-Prés
Land
8104 m2
-Prés
2023-11-09
108 000 €915 € /m²(118 m²)
Sale
House
5 rooms
118 m2
Land
2549 m2
-Prés
Land
1000 m2
-Sols
Land
113 m2
-Sols
Land
685 m2
-Sols
Land
332 m2
-Sols
2023-10-24
100 €Sale
Land
28 m2
-Prés
Land
104 m2
-Prés
116 transactions listed in the municipality
Compare with neighboring municipalities
City
name
name
house
Price per m²
Price per m²
apt.
Price per m²
Price per m²
City information
Zip code
- 61150 LOUGE SUR MAIRE
Data source & update
- Latest publication of the property value request (DVF) database made available by the DGFiP on October 19, 2025, covering transactions up to 06/30/2025:
- Administrative/cadastral division as of September 1, 2025, and municipal movements as of January 1, 2025: