emooki
HomePrice mapTransactions
🇬🇧 English🇫🇷 Français🇩🇪 Deutsch🇪🇸 Español🇮🇹 Italiano

Real estate price map


Real estate price map in the municipality of Athis-Val de Rouvre.

Orne (61)
Athis-Val de Rouvre

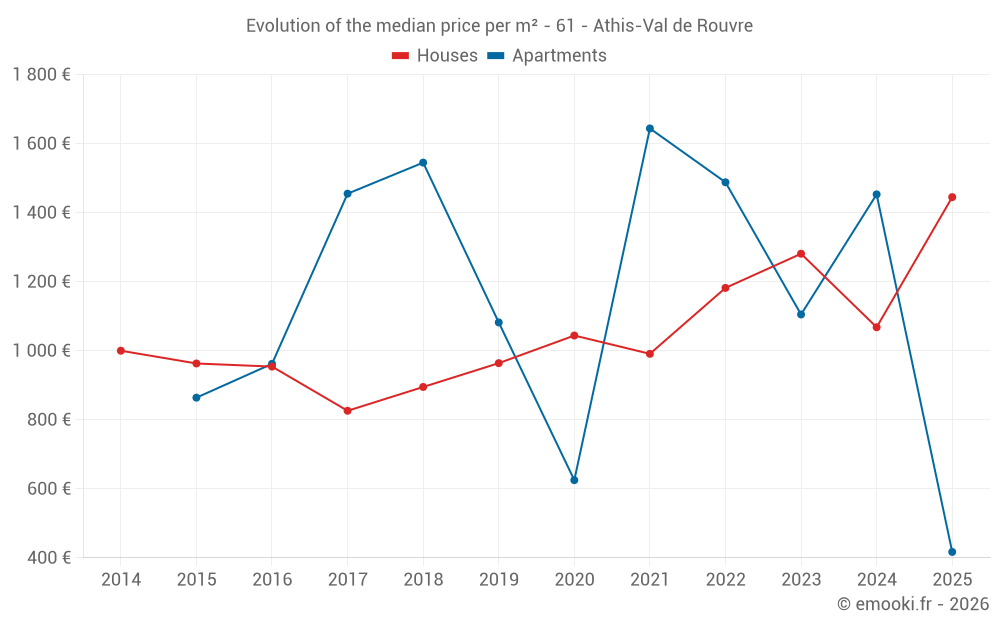
Median price of real estate
in the municipality of Athis-Val de Rouvre

HousesHouses
1 445 € /m²
1-23-45-67-89-10
Reliability 9/10
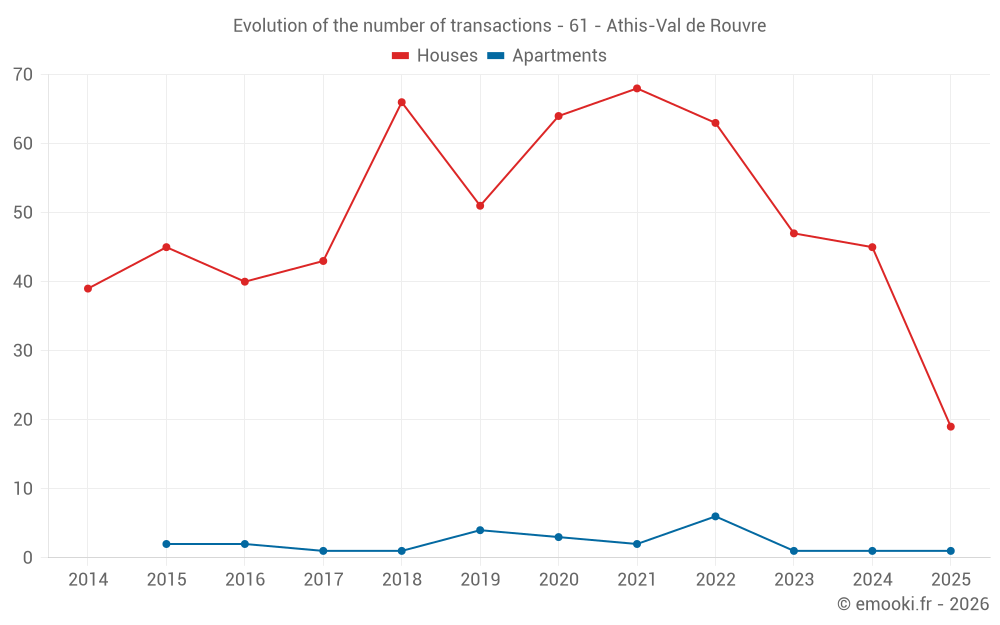
Median price on the 19 transactions of the last 6 months.
from 969 to
1 875 € /m²
60% of transactions from the 2nd to the 8th deciles.
ApartmentsApartments
1 453 € /m²
1-23-45-67-89-10
Reliability 5/10
Median price on the 11 transactions of the last 48 months.
from 1 215 to
1 618 € /m²
60% of transactions from the 2nd to the 8th deciles.
DwellingsDwellings
1 419 € /m²
1-23-45-67-89-10
Reliability 9/10
Median price on the 20 transactions of the last 6 months.
from 851 to
1 791 € /m²
60% of transactions from the 2nd to the 8th deciles.
HousesEvolution of the price per m² of houses since...
1 year
+35%
2 years
+13%
3 years
+22%
4 years
+46%
5 years
+38%
6 years
+50%
7 years
+61%
8 years
+75%
9 years
+51%
10 years
+50%
11 years
+45%
ApartmentsEvolution of the price per m² of apartments since...
1 year
--
2 years
--
3 years
--
4 years
--
5 years
--
6 years
--
7 years
--
8 years
--
9 years
--
10 years
--
11 years
--

Yearly evolution

Evolution of the median price per m²

Evolution of the number of transactions

Warning, last year incomplete. Projections made based on the proportions between semesters of the previous year at the departmental/national level and by type of property.

Yearly data

Descending order
Year
Houses
house
transactions
Houses
house
Price per m²
Apartments
apt.
transactions
Apartments
apt.
Price per m²
2025
19
1 445 €
1
417 €
2024
45
1 068 €
1
1 453 €
2023
47
1 281 €
1
1 105 €
2022
63
1 182 €
6
1 488 €
2021
68
991 €
2
1 644 €
2020
64
1 044 €
3
625 €
2019
51
964 €
4
1 082 €
2018
66
895 €
1
1 545 €
2017
43
826 €
1
1 455 €
2016
40
954 €
2
962 €
2015
45
963 €
2
864 €
2014
39
1 000 €
0
--- €

Analysis

Structure of prices per m²

Values of price percentiles per m² over the periods used for the estimated price of each type of property.

Structure of transaction amounts

Values of transaction amounts percentiles over the periods used for the estimated price of each type of property.

Transaction amounts and prices per m² by percentile

Ascending order
Percentile
Houses
house
Price per m²
Houses
house
Transaction amount
Apartments
apt.
Price per m²
Apartments
apt.
Transaction amount
10th percentile
810 €
77 170 €
1 105 €
65 000 €
20th percentile
969 €
87 200 €
1 215 €
75 000 €
30th percentile
1 231 €
102 K€
1 300 €
79 300 €
40th percentile
1 357 €
110 K€
1 442 €
79 900 €
50th percentile
1 445 €
135 K€
1 453 €
84 300 €
60th percentile
1 573 €
147 K€
1 533 €
89 000 €
70th percentile
1 604 €
170 K€
1 585 €
91 800 €
80th percentile
1 875 €
185 K€
1 618 €
95 000 €
90th percentile
2 247 €
200 K€
1 669 €
97 200 €

National and departmental comparison

Evolution of the median price per m² of houses

Evolution of the median price per m² of apartments

Quarterly evolution

Evolution of the median price per m²

Evolution of the number of transactions

Quarterly data

Descending order
Quarter
Houses
house
transactions
Houses
house
Price per m²
Apartments
apt.
transactions
Apartments
apt.
Price per m²
2025 Q2
9
1 348 €
0
--- €
2025 Q1
10
1 558 €
1
417 €
2024 Q4
16
1 074 €
0
--- €
2024 Q3
11
1 220 €
1
1 453 €
2024 Q2
12
926 €
0
--- €
2024 Q1
6
1 370 €
0
--- €
2023 Q4
13
1 254 €
1
1 105 €
2023 Q3
14
1 374 €
0
--- €
2023 Q2
5
1 520 €
0
--- €
2023 Q1
15
942 €
0
--- €
2022 Q4
14
1 323 €
2
1 559 €
2022 Q3
19
1 182 €
2
1 371 €
2022 Q2
17
1 155 €
2
1 471 €
2022 Q1
13
1 183 €
0
--- €
2021 Q4
20
1 063 €
1
1 618 €
2021 Q3
17
792 €
1
1 669 €
2021 Q2
15
1 083 €
0
--- €
2021 Q1
16
1 146 €
0
--- €
2020 Q4
21
1 090 €
1
1 207 €
2020 Q3
13
829 €
0
--- €
2020 Q2
13
1 000 €
1
625 €
2020 Q1
17
1 226 €
1
468 €
2019 Q4
16
940 €
2
1 082 €
2019 Q3
14
910 €
1
1 135 €
2019 Q2
8
932 €
0
--- €
2019 Q1
13
1 086 €
1
976 €
2018 Q4
23
839 €
1
1 545 €
2018 Q3
18
782 €
0
--- €
2018 Q2
15
1 108 €
0
--- €
2018 Q1
10
1 242 €
0
--- €
2017 Q4
8
896 €
1
1 455 €
2017 Q3
18
836 €
0
--- €
2017 Q2
11
699 €
0
--- €
2017 Q1
6
1 058 €
0
--- €
2016 Q4
9
862 €
0
--- €
2016 Q3
14
1 006 €
0
--- €
2016 Q2
6
1 146 €
2
962 €
2016 Q1
11
800 €
0
--- €
2015 Q4
13
771 €
0
--- €
2015 Q3
15
1 154 €
1
1 204 €
2015 Q2
10
1 181 €
0
--- €
2015 Q1
7
758 €
1
524 €
2014 Q4
12
1 139 €
0
--- €
2014 Q3
10
1 178 €
0
--- €
2014 Q2
12
888 €
0
--- €
2014 Q1
5
962 €
0
--- €

Orne (61)

Most expensive cities

City
name
Descending orderHouses
house
Price per m²
2 347 €
2 278 €
2 143 €
1 897 €
1 850 €
1 850 €
1 844 €
1 828 €
1 827 €
1 816 €
City
name
Descending orderApartments
apt.
Price per m²
2 150 €
1 840 €
1 776 €
1 634 €
1 574 €
1 548 €
1 542 €
1 481 €
1 470 €
1 453 €

Least expensive cities

City
name
Ascending orderHouses
house
Price per m²
385 €
532 €
620 €
659 €
669 €
677 €
701 €
726 €
740 €
City
name
Ascending orderApartments
apt.
Price per m²
7 €
20 €
129 €
162 €
174 €
201 €
262 €
281 €