emooki
HomePrice mapTransactions
🇬🇧 English🇫🇷 Français🇩🇪 Deutsch🇪🇸 Español🇮🇹 Italiano

Real estate price map


Real estate price map in the municipality of Alençon.

Orne (61)
Alençon

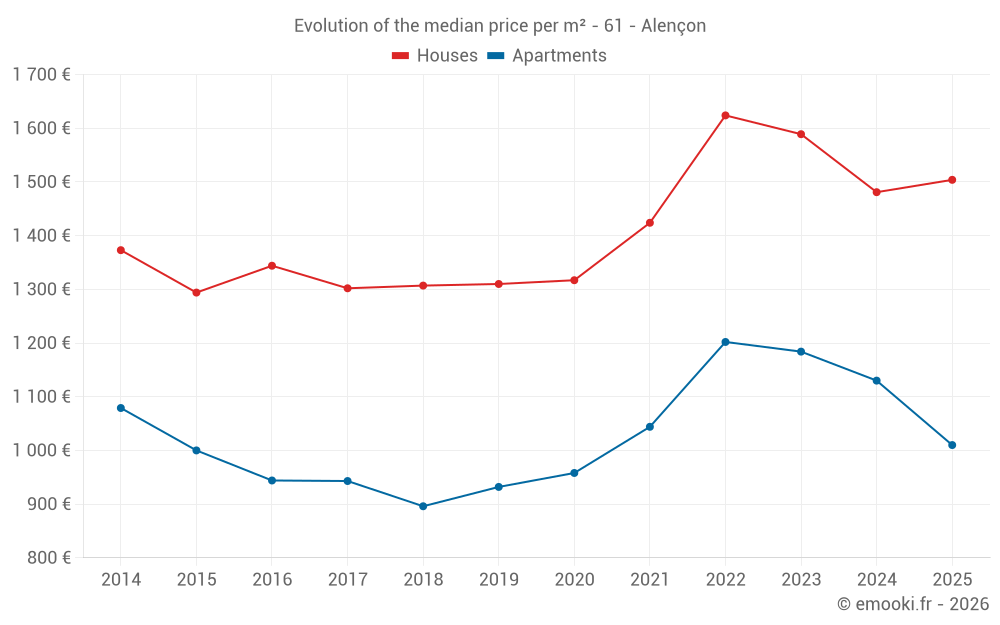
Median price of real estate
in the municipality of Alençon

HousesHouses
1 406  /m²
1-23-45-67-89-10
Reliability 10/10
Median price on the 27 transactions of the last 3 months.
from 1 135 to
1 672  /m²
60% of transactions from the 2nd to the 8th deciles.
ApartmentsApartments
1 064  /m²
1-23-45-67-89-10
Reliability 10/10
Median price on the 24 transactions of the last 3 months.
from 584 to
1 429  /m²
60% of transactions from the 2nd to the 8th deciles.
DwellingsDwellings
1 231  /m²
1-23-45-67-89-10
Reliability 10/10
Median price on the 51 transactions of the last 3 months.
from 804 to
1 610  /m²
60% of transactions from the 2nd to the 8th deciles.
HousesEvolution of the price per m² of houses since...
1 year
+1.6%
2 years
-5.3%
3 years
-7.4%
4 years
+5.6%
5 years
+14%
6 years
+15%
7 years
+15%
8 years
+16%
9 years
+12%
10 years
+16%
11 years
+10%
ApartmentsEvolution of the price per m² of apartments since...
1 year
-11%
2 years
-15%
3 years
-16%
4 years
-3.3%
5 years
+5.4%
6 years
+8.4%
7 years
+13%
8 years
+7.1%
9 years
+7%
10 years
+1%
11 years
-6.4%

Yearly evolution

Evolution of the median price per m²

Evolution of the number of transactions

Warning, last year incomplete. Projections made based on the proportions between semesters of the previous year at the departmental/national level and by type of property.

Yearly data

Descending order
Year
Houses
house
transactions
Houses
house
Price per m²
Apartments
apt.
transactions
Apartments
apt.
Price per m²
2025
78
1 504 
50
1 010 
2024
157
1 481 
134
1 130 
2023
185
1 589 
160
1 184 
2022
214
1 624 
166
1 202 
2021
226
1 424 
184
1 044 
2020
196
1 317 
161
958 
2019
180
1 310 
163
932 
2018
165
1 307 
126
896 
2017
162
1 302 
120
943 
2016
166
1 344 
120
944 
2015
107
1 294 
91
1 000 
2014
157
1 373 
83
1 079 

Analysis

Structure of prices per m²

Values of price percentiles per m² over the periods used for the estimated price of each type of property.

Structure of transaction amounts

Values of transaction amounts percentiles over the periods used for the estimated price of each type of property.

Transaction amounts and prices per m² by percentile

Ascending order
Percentile
Houses
house
Price per m²
Houses
house
Transaction amount
Apartments
apt.
Price per m²
Apartments
apt.
Transaction amount
10th percentile
962 
68 000 
528 
30 300 
20th percentile
1 135 
90 000 
584 
32 600 
30th percentile
1 217 
91 600 
730 
34 900 
40th percentile
1 322 
97 000 
878 
36 664 
50th percentile
1 406 
101 K
1 064 
44 881 
60th percentile
1 443 
125 K
1 188 
58 700 
70th percentile
1 617 
137 K
1 247 
68 000 
80th percentile
1 672 
168 K
1 429 
71 372 
90th percentile
1 846 
191 K
1 526 
118 K

National and departmental comparison

Evolution of the median price per m² of houses

Evolution of the median price per m² of apartments

Quarterly evolution

Evolution of the median price per m²

Evolution of the number of transactions

Quarterly data

Descending order
Quarter
Houses
house
transactions
Houses
house
Price per m²
Apartments
apt.
transactions
Apartments
apt.
Price per m²
2025 Q2
27
1 406 
24
1 064 
2025 Q1
51
1 555 
26
987 
2024 Q4
46
1 460 
35
1 149 
2024 Q3
37
1 517 
37
1 278 
2024 Q2
44
1 536 
29
1 137 
2024 Q1
30
1 416 
33
1 000 
2023 Q4
53
1 569 
40
1 177 
2023 Q3
37
1 702 
35
1 204 
2023 Q2
44
1 601 
44
1 200 
2023 Q1
51
1 557 
41
1 172 
2022 Q4
56
1 559 
36
1 244 
2022 Q3
50
1 509 
47
1 229 
2022 Q2
67
1 702 
55
1 158 
2022 Q1
41
1 625 
28
1 176 
2021 Q4
47
1 456 
38
1 044 
2021 Q3
68
1 466 
55
1 069 
2021 Q2
70
1 414 
45
1 009 
2021 Q1
41
1 372 
46
1 012 
2020 Q4
46
1 352 
43
971 
2020 Q3
53
1 296 
43
1 015 
2020 Q2
54
1 291 
50
948 
2020 Q1
43
1 364 
25
921 
2019 Q4
57
1 220 
38
985 
2019 Q3
55
1 382 
39
909 
2019 Q2
38
1 280 
42
926 
2019 Q1
30
1 318 
44
880 
2018 Q4
44
1 332 
33
1 143 
2018 Q3
47
1 375 
33
882 
2018 Q2
36
1 274 
34
910 
2018 Q1
38
1 278 
26
856 
2017 Q4
43
1 289 
23
1 017 
2017 Q3
41
1 434 
36
952 
2017 Q2
35
1 238 
26
946 
2017 Q1
43
1 289 
35
909 
2016 Q4
43
1 219 
23
1 104 
2016 Q3
52
1 320 
38
992 
2016 Q2
48
1 412 
35
856 
2016 Q1
23
1 283 
24
974 
2015 Q4
32
1 250 
22
985 
2015 Q3
33
1 154 
25
992 
2015 Q2
26
1 405 
32
989 
2015 Q1
16
1 266 
12
1 152 
2014 Q4
36
1 588 
16
1 032 
2014 Q3
40
1 351 
26
1 205 
2014 Q2
44
1 274 
18
1 240 
2014 Q1
37
1 341 
23
948 

Orne (61)

Most expensive cities

City
name
Descending orderHouses
house
Price per m²
2 278 
1 897 
1 850 
1 828 
1 827 
1 816 
City
name
Descending orderApartments
apt.
Price per m²
1 840 
1 776 
1 574 
1 548 
1 542 
1 481 

Least expensive cities

City
name
Ascending orderHouses
house
Price per m²
620 
659 
677 
701 
726 
740 
City
name
Ascending orderApartments
apt.
Price per m²
162 
174 
201