emooki
HomePrice mapTransactions
🇬🇧 English🇫🇷 Français🇩🇪 Deutsch🇪🇸 Español🇮🇹 Italiano

Real estate price map


Real estate price map in the municipality of L'Aigle.

Orne (61)
L'Aigle

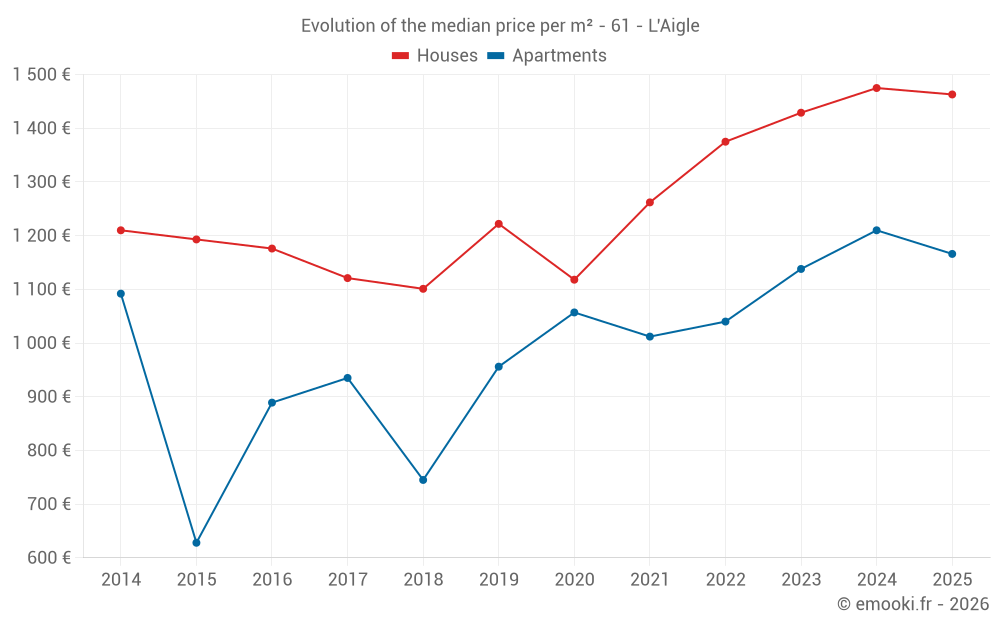
Median price of real estate
in the municipality of L'Aigle

HousesHouses
1 463 € /m²
1-23-45-67-89-10
Reliability 9/10
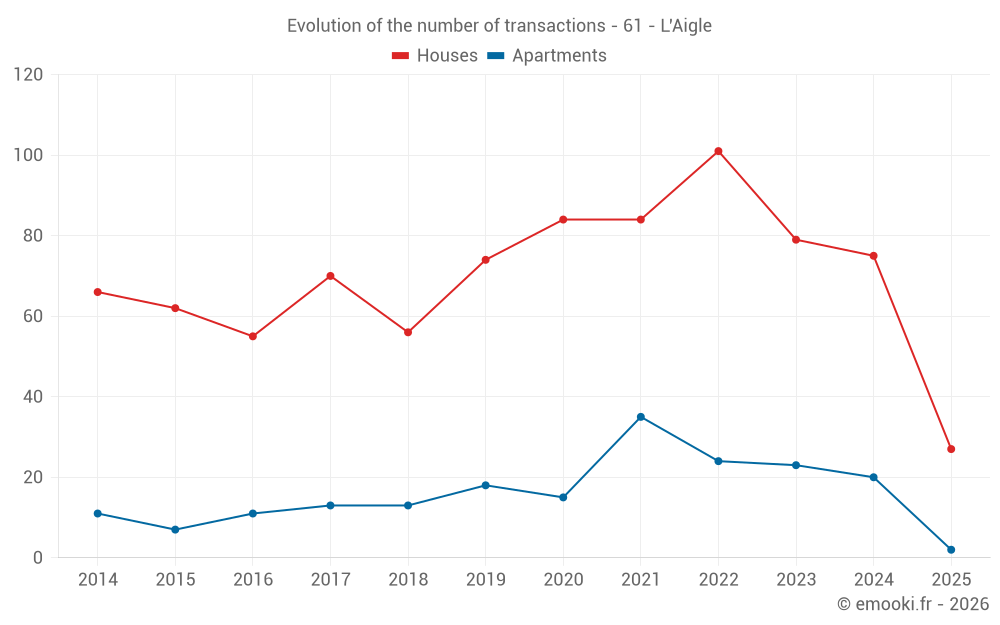
Median price on the 27 transactions of the last 6 months.
from 1 215 to
1 713 € /m²
60% of transactions from the 2nd to the 8th deciles.
ApartmentsApartments
1 186 € /m²
1-23-45-67-89-10
Reliability 7/10
Median price on the 31 transactions of the last 24 months.
from 943 to
1 752 € /m²
60% of transactions from the 2nd to the 8th deciles.
DwellingsDwellings
1 446 € /m²
1-23-45-67-89-10
Reliability 9/10
Median price on the 29 transactions of the last 6 months.
from 1 178 to
1 702 € /m²
60% of transactions from the 2nd to the 8th deciles.
HousesEvolution of the price per m² of houses since...
1 year
-0.8%
2 years
+2.4%
3 years
+6.4%
4 years
+16%
5 years
+31%
6 years
+20%
7 years
+33%
8 years
+31%
9 years
+24%
10 years
+23%
11 years
+21%
ApartmentsEvolution of the price per m² of apartments since...
1 year
--
2 years
--
3 years
--
4 years
--
5 years
--
6 years
--
7 years
--
8 years
--
9 years
--
10 years
--
11 years
--

Yearly evolution

Evolution of the median price per m²

Evolution of the number of transactions

Warning, last year incomplete. Projections made based on the proportions between semesters of the previous year at the departmental/national level and by type of property.

Yearly data

Descending order
Year
Houses
house
transactions
Houses
house
Price per m²
Apartments
apt.
transactions
Apartments
apt.
Price per m²
2025
27
1 463 €
2
1 166 €
2024
75
1 475 €
20
1 210 €
2023
79
1 429 €
23
1 138 €
2022
101
1 375 €
24
1 040 €
2021
84
1 262 €
35
1 012 €
2020
84
1 118 €
15
1 057 €
2019
74
1 222 €
18
956 €
2018
56
1 101 €
13
745 €
2017
70
1 121 €
13
935 €
2016
55
1 176 €
11
889 €
2015
62
1 193 €
7
628 €
2014
66
1 210 €
11
1 092 €

Analysis

Structure of prices per m²

Values of price percentiles per m² over the periods used for the estimated price of each type of property.

Structure of transaction amounts

Values of transaction amounts percentiles over the periods used for the estimated price of each type of property.

Transaction amounts and prices per m² by percentile

Ascending order
Percentile
Houses
house
Price per m²
Houses
house
Transaction amount
Apartments
apt.
Price per m²
Apartments
apt.
Transaction amount
10th percentile
965 €
83 200 €
806 €
50 000 €
20th percentile
1 215 €
95 400 €
943 €
52 000 €
30th percentile
1 365 €
99 600 €
1 053 €
56 000 €
40th percentile
1 405 €
108 K€
1 136 €
60 000 €
50th percentile
1 463 €
112 K€
1 186 €
79 000 €
60th percentile
1 498 €
121 K€
1 250 €
100 K€
70th percentile
1 596 €
138 K€
1 295 €
125 K€
80th percentile
1 713 €
151 K€
1 752 €
155 K€
90th percentile
1 892 €
199 K€
1 889 €
205 K€

National and departmental comparison

Evolution of the median price per m² of houses

Evolution of the median price per m² of apartments

Quarterly evolution

Evolution of the median price per m²

Evolution of the number of transactions

Quarterly data

Descending order
Quarter
Houses
house
transactions
Houses
house
Price per m²
Apartments
apt.
transactions
Apartments
apt.
Price per m²
2025 Q2
11
1 500 €
1
1 279 €
2025 Q1
16
1 408 €
1
1 053 €
2024 Q4
19
1 475 €
4
1 242 €
2024 Q3
21
1 400 €
7
1 167 €
2024 Q2
24
1 472 €
5
1 295 €
2024 Q1
11
1 543 €
4
1 469 €
2023 Q4
20
1 309 €
4
1 149 €
2023 Q3
23
1 450 €
5
850 €
2023 Q2
13
1 438 €
6
1 110 €
2023 Q1
23
1 395 €
8
1 169 €
2022 Q4
19
1 569 €
2
1 056 €
2022 Q3
31
1 347 €
1
1 128 €
2022 Q2
31
1 241 €
11
1 000 €
2022 Q1
20
1 368 €
10
1 090 €
2021 Q4
26
1 237 €
13
1 056 €
2021 Q3
21
1 306 €
11
890 €
2021 Q2
22
1 348 €
8
1 042 €
2021 Q1
15
1 011 €
3
982 €
2020 Q4
29
1 122 €
4
1 116 €
2020 Q3
23
1 198 €
2
620 €
2020 Q2
17
1 037 €
4
1 394 €
2020 Q1
15
1 167 €
5
956 €
2019 Q4
23
1 125 €
7
1 185 €
2019 Q3
20
1 176 €
4
1 696 €
2019 Q2
21
1 403 €
4
929 €
2019 Q1
10
1 150 €
3
846 €
2018 Q4
12
974 €
3
1 968 €
2018 Q3
16
1 382 €
3
659 €
2018 Q2
17
994 €
2
960 €
2018 Q1
11
1 000 €
5
1 116 €
2017 Q4
22
1 246 €
3
935 €
2017 Q3
13
1 090 €
2
684 €
2017 Q2
14
928 €
4
968 €
2017 Q1
21
1 125 €
4
1 327 €
2016 Q4
10
1 163 €
5
678 €
2016 Q3
18
1 232 €
2
849 €
2016 Q2
13
1 127 €
2
1 528 €
2016 Q1
14
1 184 €
2
773 €
2015 Q4
12
1 193 €
1
1 838 €
2015 Q3
17
1 130 €
2
795 €
2015 Q2
21
1 284 €
3
620 €
2015 Q1
12
928 €
1
628 €
2014 Q4
21
1 286 €
3
2 000 €
2014 Q3
13
1 172 €
6
831 €
2014 Q2
15
1 082 €
0
--- €
2014 Q1
17
1 196 €
2
1 224 €

Orne (61)

Most expensive cities

City
name
Descending orderHouses
house
Price per m²
2 347 €
2 278 €
2 143 €
1 897 €
1 850 €
1 850 €
1 844 €
1 828 €
1 827 €
1 816 €
City
name
Descending orderApartments
apt.
Price per m²
2 150 €
1 840 €
1 776 €
1 634 €
1 574 €
1 548 €
1 542 €
1 481 €
1 470 €
1 453 €

Least expensive cities

City
name
Ascending orderHouses
house
Price per m²
385 €
532 €
620 €
659 €
669 €
677 €
701 €
726 €
740 €
City
name
Ascending orderApartments
apt.
Price per m²
7 €
20 €
129 €
162 €
174 €
201 €
262 €
281 €