Real estate price map
Real estate price map in the municipality of Gouffern en Auge, choose a section to see transactions by parcel.
Price per m² in Gouffern en Auge
Median price of real estate
in the municipality of Gouffern en Auge
1 954 € /m²
1 954 € /m²
1033 transactions listed in the municipality
Yearly data
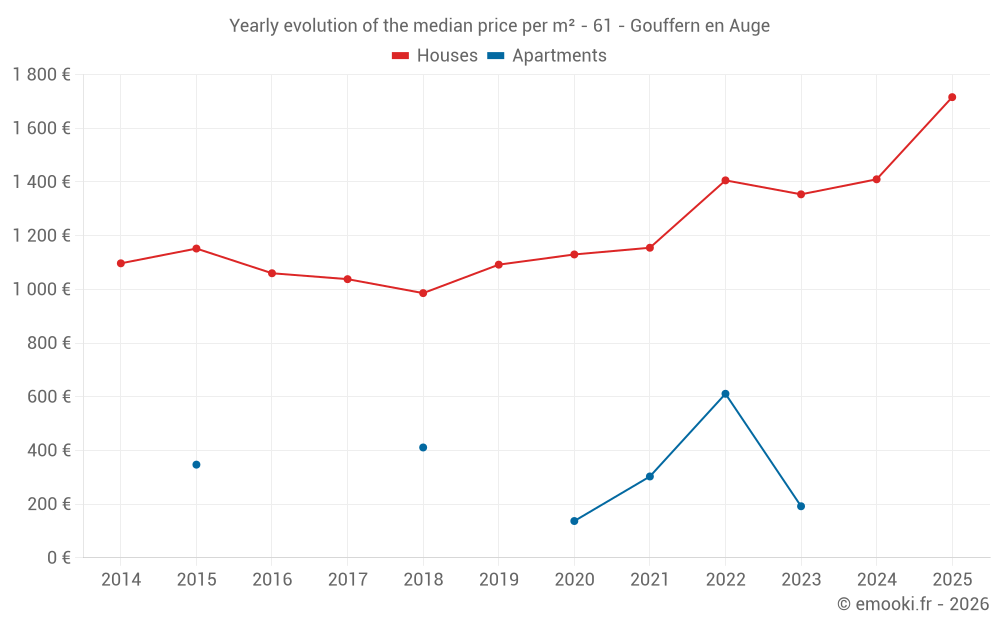
Yearly evolution of the median price per m²
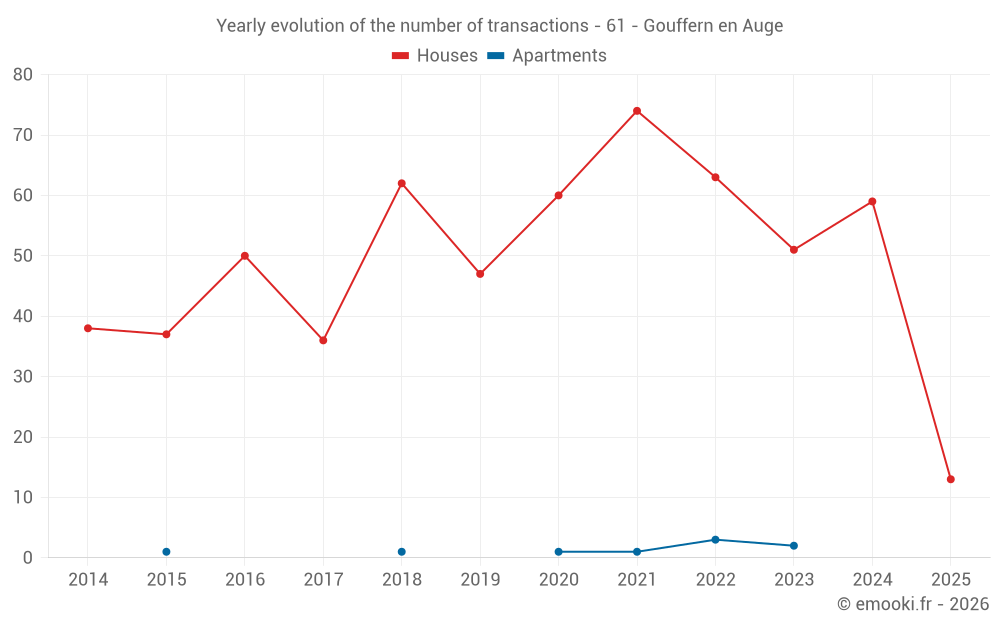
Yearly evolution of the number of transactions
Warning, last year incomplete. Projections made based on the proportions between semesters of the previous year at the departmental/national level and by type of property.
Yearly table
transactions
Price per m²
transactions
Price per m²
Analysis
Structure of prices per m²
Values of price percentiles per m² over the periods used for the estimated price of each type of property.
Structure of transaction amounts
Values of transaction amounts percentiles over the periods used for the estimated price of each type of property.
Transaction amounts and prices per m² by percentile
Price per m²
Transaction amount
Price per m²
Transaction amount
National and departmental comparison
Evolution of the median price per m² of houses
Evolution of the median price per m² of apartments
Quarterly data
Quarterly evolution of the median price per m²
Quarterly evolution of the number of transactions
Quarterly table
transactions
Price per m²
transactions
Price per m²
Key takeaways
What is the price per m2 of houses in Gouffern en Auge?
The median price on the 47 house transactions of the last 12 months in the municipality of Gouffern en Auge was 1 563 € per square meter for a median property value of 138 000 €. Over this period, 60% of transactions were between 1 146 and 1 954 € per square meter (from the 2nd to the 8th deciles).
Compare with neighboring municipalities
name
Price per m²
Price per m²
City information
Zip codes
- AUBRY EN EXMES 61160 GOUFFERN EN AUGE
- CHAMBOIS 61160 GOUFFERN EN AUGE
- FEL 61160 GOUFFERN EN AUGE
- OMMEEL 61160 GOUFFERN EN AUGE
- UROU ET CRENNES 61200 GOUFFERN EN AUGE
- AVERNES SOUS EXMES 61310 GOUFFERN EN AUGE
- COURMENIL 61310 GOUFFERN EN AUGE
- EXMES 61310 GOUFFERN EN AUGE
- LA COCHERE 61310 GOUFFERN EN AUGE
- LE BOURG ST LEONARD 61310 GOUFFERN EN AUGE
- SILLY EN GOUFFERN 61310 GOUFFERN EN AUGE
- ST PIERRE LA RIVIERE 61310 GOUFFERN EN AUGE
- SURVIE 61310 GOUFFERN EN AUGE
- VILLEBADIN 61310 GOUFFERN EN AUGE