emooki
HomePrice mapTransactions
🇬🇧 English🇫🇷 Français🇩🇪 Deutsch🇪🇸 Español🇮🇹 Italiano

Real estate price map


Real estate price map in the municipality of Briouze, choose a section to see transactions by parcel.

Orne (61)

Briouze - Real estate price m²

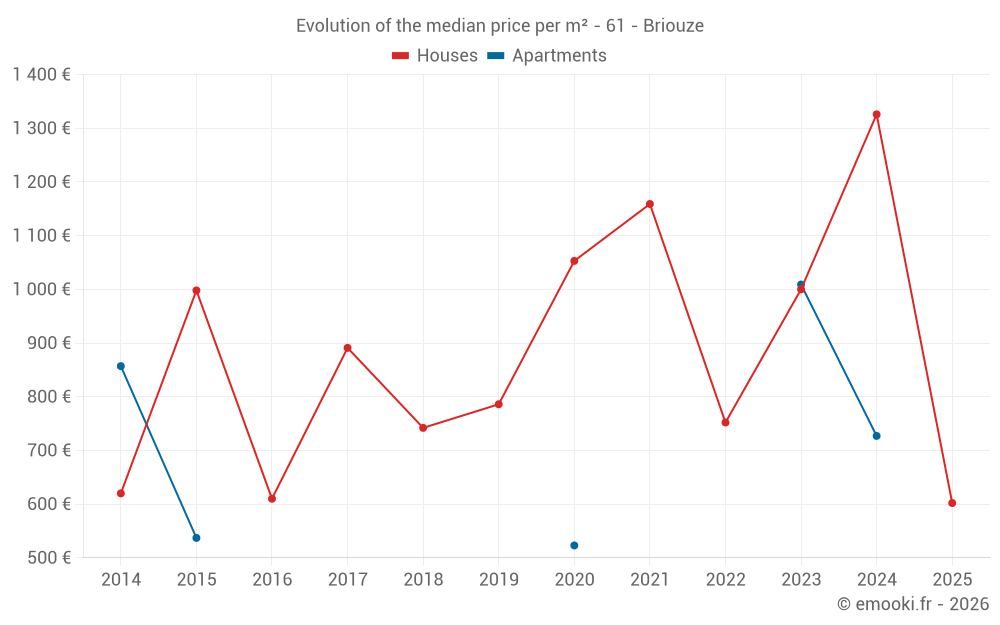
Median price of real estate
in the municipality of Briouze

HousesHouses
1 297  /m²
1-23-45-67-89-10
Reliability 8/10
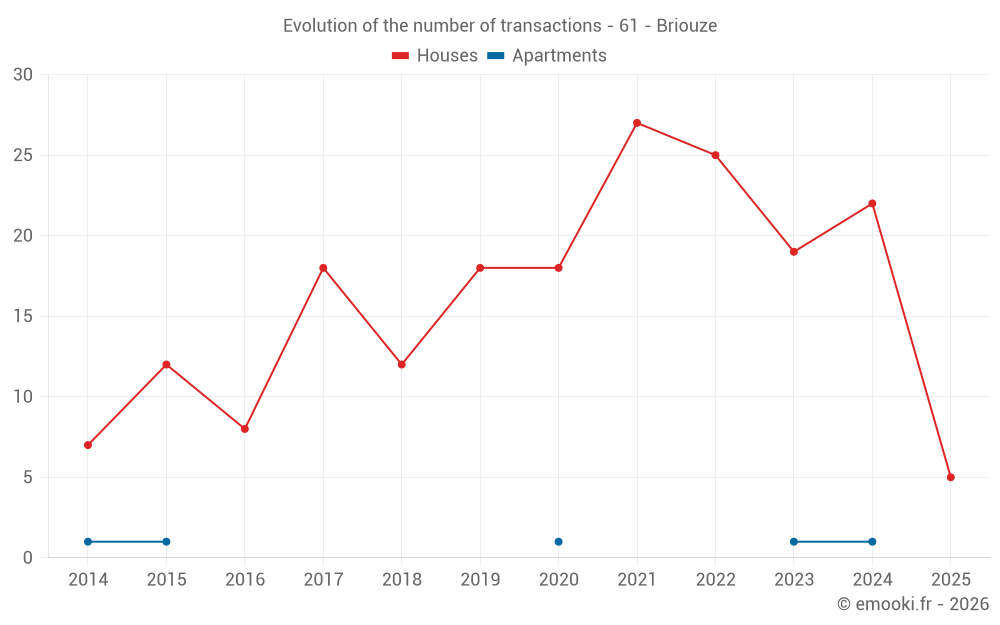
Median price on the 17 transactions of the last 12 months.
from 633 to
1 836  /m²
60% of transactions from the 2nd to the 8th deciles.
ApartmentsApartments
727  /m²
1-23-45-67-89-10
Reliability 1/10
Median price on the 3 transactions of the last 120 months.
DwellingsDwellings
1 238  /m²
1-23-45-67-89-10
Reliability 8/10
Median price on the 18 transactions of the last 12 months.
from 652 to
1 783  /m²
60% of transactions from the 2nd to the 8th deciles.
HousesEvolution of the price per m² of houses since...
1 year
-55%
2 years
-40%
3 years
-20%
4 years
-48%
5 years
-43%
6 years
-23%
7 years
-19%
8 years
-32%
9 years
-1.3%
10 years
-40%
11 years
-2.9%

Yearly evolution

Evolution of the median price per m²

Evolution of the median price per m² - 61 - Briouze

Evolution of the number of transactions

Warning, last year incomplete. Projections made based on the proportions between semesters of the previous year at the departmental/national level and by type of property.

Evolution of the number of transactions - 61 - Briouze

Yearly data

Descending order
Year
Houses
house
transactions
Houses
house
Price per m²
Apartments
apt.
transactions
Apartments
apt.
Price per m²
2025
5
602 
0
--- 
2024
22
1 326 
1
727 
2023
19
1 000 
1
1 009 
2022
25
752 
0
--- 
2021
27
1 159 
0
--- 
2020
18
1 053 
1
523 
2019
18
786 
0
--- 
2018
12
742 
0
--- 
2017
18
891 
0
--- 
2016
8
610 
0
--- 
2015
12
998 
1
537 
2014
7
620 
1
857 

Analysis

Structure of prices per m²

Values of price percentiles per m² over the periods used for the estimated price of each type of property.

Structure of transaction amounts

Values of transaction amounts percentiles over the periods used for the estimated price of each type of property.

Transaction amounts and prices per m² by percentile

Ascending order
Percentile
Houses
house
Price per m²
Houses
house
Transaction amount
Apartments
apt.
Price per m²
Apartments
apt.
Transaction amount
10th percentile
508 
46 940 
564 
66 400 
20th percentile
633 
61 400 
605 
76 800 
30th percentile
917 
77 400 
645 
87 200 
40th percentile
1 156 
86 485 
686 
97 600 
50th percentile
1 297 
96 000 
727 
108 K
60th percentile
1 356 
102 K
783 
110 K
70th percentile
1 468 
146 K
840 
113 K
80th percentile
1 836 
166 K
896 
115 K
90th percentile
2 072 
203 K
953 
118 K

National and departmental comparison

Evolution of the median price per m² of houses

Evolution of the median price per m² of apartments

Quarterly evolution

Evolution of the median price per m²

Evolution of the number of transactions

Quarterly data

Descending order
Quarter
Houses
house
transactions
Houses
house
Price per m²
Apartments
apt.
transactions
Apartments
apt.
Price per m²
2025 Q2
2
778 
0
--- 
2025 Q1
3
602 
0
--- 
2024 Q4
7
1 179 
0
--- 
2024 Q3
5
1 889 
1
727 
2024 Q2
5
843 
0
--- 
2024 Q1
5
1 438 
0
--- 
2023 Q4
5
1 007 
0
--- 
2023 Q3
5
1 170 
0
--- 
2023 Q2
5
875 
1
1 009 
2023 Q1
4
1 140 
0
--- 
2022 Q4
8
691 
0
--- 
2022 Q3
7
836 
0
--- 
2022 Q2
4
666 
0
--- 
2022 Q1
6
903 
0
--- 
2021 Q4
5
1 176 
0
--- 
2021 Q3
7
1 214 
0
--- 
2021 Q2
11
769 
0
--- 
2021 Q1
4
1 202 
0
--- 
2020 Q4
5
900 
1
523 
2020 Q3
2
962 
0
--- 
2020 Q2
6
1 142 
0
--- 
2020 Q1
5
1 016 
0
--- 
2019 Q4
2
1 130 
0
--- 
2019 Q3
6
704 
0
--- 
2019 Q2
7
859 
0
--- 
2019 Q1
3
685 
0
--- 
2018 Q4
2
1 022 
0
--- 
2018 Q3
5
422 
0
--- 
2018 Q2
1
658 
0
--- 
2018 Q1
4
500 
0
--- 
2017 Q4
5
1 111 
0
--- 
2017 Q2
6
1 079 
0
--- 
2017 Q1
7
593 
0
--- 
2016 Q4
3
867 
0
--- 
2016 Q3
1
579 
0
--- 
2016 Q2
2
401 
0
--- 
2016 Q1
2
1 129 
0
--- 
2015 Q4
6
1 103 
0
--- 
2015 Q3
1
286 
0
--- 
2015 Q2
4
874 
1
537 
2015 Q1
1
1 191 
0
--- 
2014 Q4
1
456 
0
--- 
2014 Q3
1
847 
1
857 
2014 Q2
2
230 
0
--- 
2014 Q1
3
986 
0
--- 

Overview of the latest real estate transactions

The following list is an anonymized overview of the latest transactions. For more details and to find all transactions, please use the map to view transactions by plot or the transaction search page for a search by criteria.

2025-06-05
700 
Sale
Land
310 m2
-Jardins
/Jardin potager
2025-05-24
20 000 
408  /m²(49 m²)
800  /m²(25 m²)
Sale
Houses
House
1 room
25 m2
Commercial property
24 m2
Land
46 m2
-Sols
2025-04-29
23 300 
201  /m²(116 m²)
Sale
Houses
House
4 rooms
116 m2
Land
826 m2
-Sols
2025-04-03
89 500 
1 356  /m²(66 m²)
Sale
Houses
House
4 rooms
66 m2
Land
12233 m2
-Prés
Land
1000 m2
-Sols
Land
10930 m2
-Peupleraies
Land
1280 m2
-Jardins
/Jardin potager
Land
1260 m2
-Prés
2025-04-03
15 000 
Sale
Land
1000 m2
-Sols
Land
467 m2
-Prés
Land
44 m2
-Sols
2025-03-29
2 000 
Sale
Land
13415 m2
-Prés
2025-03-19
97 500 
602  /m²(162 m²)
Sale
Land
862 m2
-Prés
Land
497 m2
-Prés
Houses
House
7 rooms
162 m2
Land
452 m2
-Jardins
/Jardin potager
Land
2557 m2
-Prés
Land
134 m2
-Sols
Land
1113 m2
-Terrains d'agrément
/Parc
Land
1000 m2
-Sols
2025-02-20
3 000 
Sale
Land
6455 m2
-Prés
2025-02-17
80 000 
755  /m²(106 m²)
Sale
Houses
House
4 rooms
106 m2
Land
111 m2
-Sols
2025-02-14
84 475 
500  /m²(169 m²)
Sale
Houses
House
6 rooms
169 m2
Land
183 m2
-Sols
2025-01-28
500 000 
305  /m²(1638 m²)
Sale
Commercial property
Commercial property
Commercial property
1638 m2
2 outbuildings
Land
1880 m2
-Jardins
/Jardin potager
Land
14260 m2
-Sols
Land
3350 m2
-Jardins
/Jardin potager
Land
3245 m2
-Terrains d'agrément
/Parc
2025-01-28
3 090 
Sale
Land
309 m2
-Jardins
/Jardin potager
2024-12-30
22 924 
Sale
Land
24844 m2
-Terres
Land
1269 m2
-Terres
Land
8622 m2
-Prés
2024-12-17
109 900 
2 035  /m²(54 m²)
2 892  /m²(38 m²)
Sale
Houses
House
2 rooms
38 m2
Commercial property
16 m2
Land
92 m2
-Sols
2024-12-11
14 000 
Sale
2 outbuildings
Land
36 m2
-Sols
2024-12-10
38 000 
514  /m²(74 m²)
Sale
Houses
House
3 rooms
74 m2
Land
57 m2
-Sols
2024-12-09
1 550 
Sale
Land
535 m2
-Prés
2024-10-31
257 000 
2 008  /m²(128 m²)
Sale
Houses
House
4 rooms
128 m2
Land
1050 m2
-Sols
2024-10-29
32 000 
432  /m²(74 m²)
821  /m²(39 m²)
Sale
Apartments
Apartment
3 rooms
39 m2
Commercial property
35 m2
2 outbuildings
Land
62 m2
-Sols
2024-10-24
147 660 
1 623  /m²(91 m²)
Sale
Houses
House
3 rooms
91 m2
Land
4649 m2
-Prés
Land
1000 m2
-Sols
Land
2000 m2
-Terrains d'agrément
/Parc
Land
26385 m2
-Terres
389 transactions listed in the municipality

Orne (61)

Most expensive cities

City
name
Descending orderHouses
house
Price per m²
2 278 
1 897 
1 850 
1 828 
1 827 
1 816 
City
name
Descending orderApartments
apt.
Price per m²
1 840 
1 776 
1 574 
1 548 
1 542 
1 481 

Least expensive cities

City
name
Ascending orderHouses
house
Price per m²
620 
659 
677 
701 
726 
740 
City
name
Ascending orderApartments
apt.
Price per m²
162 
174 
201